

Low (web) Quality - BALTEX
Low (web) Quality - BALTEX
Low (web) Quality - BALTEX

Create successful ePaper yourself
Turn your PDF publications into a flip-book with our unique Google optimized e-Paper software.
140<br />
Atlantic Ocean (19-39°N, 75-95°W). WRF horizontal grid<br />
spacing was 9 km and the model was integrated at 31<br />
vertical levels. All simulations covered the period August<br />
27-31. WRF simulations were forced by data derived from<br />
the A2 climate change scenario defined by the IPCC (2007),<br />
as simulated by the GISS AOGCM (Russell et al. 1995;<br />
Rangwala et al. 2006). The AOGCM uses a 4° x 5°<br />
horizontal grid at nine vertical atmospheric levels and 13<br />
vertical ocean levels.<br />
there are not larger and more severe hurricanes in the<br />
second half of the 20 th century.<br />
4. Results<br />
Simulations of Hurricane Katrina using the WRF model on a<br />
9 km grid over the Gulf of Mexico and the Southeast US<br />
were analyzed during the period August 27-30, 2005. The<br />
control captured many of the observed characteristics of<br />
Katrina (not shown), although the predicted center was<br />
about 150 km to the actual land falling position. WRF storm<br />
tracks were determined from the locations of minimum sealevel<br />
pressure every three hours. (not shown). The tracks of<br />
the storms in the first half of the century were mostly east of<br />
the simulated (control) 2005 storm. Tracks in the second<br />
half the century were mostly west of the control.<br />
Vertical profiles of the Gulf of Mexico averaged u-wind<br />
component from the GCM for simulations representing the<br />
earlier decades showed a large positive vertical shear<br />
relative to the CTL, reaching maxima between<br />
approximately 12-16 km altitude. Profiles from the latter<br />
decades showed a negative anomaly shear up to about 8-10<br />
km altitude. Each consistent with the differences in tracks<br />
discussed above. The vertical shear of the zonal wind is<br />
proportional to north-south temperature gradients. The<br />
negative shear in the simulations representing the second<br />
half of this century indicates a weakening or a reversal of the<br />
usual south to north temperature gradient. This can occur<br />
when the continent north of the Gulf of Mexico becomes<br />
excessively warm compared to the water temperature. In<br />
contrast, the GCM sea surface temperatures were predicted<br />
to fall in the first two decades, explaining in part the positive<br />
anomalies in the u-wind component during this time.<br />
However, predicted Gulf of Mexico sea surface<br />
temperatures exceeded those of the present decade from the<br />
2030s onward, increasing by about 3 o C by the 2090s.<br />
Fig. 1 compares the horizontal distribution of surface wind<br />
speed of the 2070s to the control. After 54 hours (06 UT on<br />
August 29). the 2070s storm center crossed the Louisiana<br />
coastline at 90°W, displaced further west from the control.<br />
The 2070s storm is more compact than the control. For<br />
example, the diameter within which its wind speeds exceed<br />
30 m/s is about 20% smaller than for the control (2.9° versus<br />
3.6°). Hence, the average wind speeds within, for example,<br />
180 km of the core were less than in the control.<br />
Nevertheless, the future storm maintained its core of very<br />
high winds better than the control as it approached the coast.<br />
The 2070s storm shows narrow rings of wind speeds in<br />
excess of 50 m/s. but unlike the control its bands of wind<br />
speed exceeding 50 m/s completely surround the storm<br />
center. Similar results were obtained for the simulated<br />
storm in the 2080s.<br />
5. Sensitivity Tests<br />
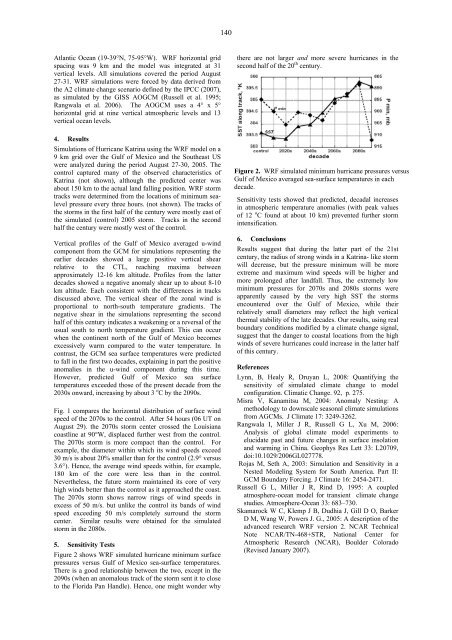
Figure 2 shows WRF simulated hurricane minimum surface<br />
pressures versus Gulf of Mexico sea-surface temperatures.<br />
There is a good relationship between the two, except in the<br />
2090s (when an anomalous track of the storm sent it to close<br />
to the Florida Pan Handle). Hence, one might wonder why<br />
Figure 2. WRF simulated minimum hurricane pressures versus<br />
Gulf of Mexico averaged sea-surface temperatures in each<br />
decade.<br />
Sensitivity tests showed that predicted, decadal increases<br />
in atmospheric temperature anomalies (with peak values<br />
of 12 o C found at about 10 km) prevented further storm<br />
intensification.<br />
6. Conclusions<br />
Results suggest that during the latter part of the 21st<br />
century, the radius of strong winds in a Katrina- like storm<br />
will decrease, but the pressure minimum will be more<br />
extreme and maximum wind speeds will be higher and<br />
more prolonged after landfall. Thus, the extremely low<br />
minimum pressures for 2070s and 2080s storms were<br />
apparently caused by the very high SST the storms<br />
encountered over the Gulf of Mexico, while their<br />
relatively small diameters may reflect the high vertical<br />
thermal stability of the late decades. Our results, using real<br />
boundary conditions modified by a climate change signal,<br />
suggest that the danger to coastal locations from the high<br />
winds of severe hurricanes could increase in the latter half<br />
of this century.<br />
References<br />
Lynn, B, Healy R, Druyan L, 2008: Quantifying the<br />
sensitivity of simulated climate change to model<br />
configuration. Climatic Change. 92, p. 275.<br />
Misra V, Kanamitsu M, 2004: Anomaly Nesting: A<br />
methodology to downscale seasonal climate simulations<br />
from AGCMs. J Climate 17: 3249-3262.<br />
Rangwala I, Miller J R, Russell G L, Xu M, 2006:<br />
Analysis of global climate model experiments to<br />
elucidate past and future changes in surface insolation<br />
and warming in China. Geophys Res Lett 33: L20709,<br />
doi:10.1029/2006GL027778.<br />
Rojas M, Seth A, 2003: Simulation and Sensitivity in a<br />
Nested Modeling System for South America. Part II:<br />
GCM Boundary Forcing. J Climate 16: 2454-2471.<br />
Russell G L, Miller J R, Rind D, 1995: A coupled<br />
atmosphere-ocean model for transient climate change<br />
studies. Atmosphere-Ocean 33: 683–730.<br />
Skamarock W C, Klemp J B, Dudhia J, Gill D O, Barker<br />
D M, Wang W, Powers J. G., 2005: A description of the<br />
advanced research WRF version 2. NCAR Technical<br />
Note NCAR/TN-468+STR, National Center for<br />
Atmospheric Research (NCAR), Boulder Colorado<br />
(Revised January 2007).


