

Low (web) Quality - BALTEX
Low (web) Quality - BALTEX
Low (web) Quality - BALTEX

You also want an ePaper? Increase the reach of your titles
YUMPU automatically turns print PDFs into web optimized ePapers that Google loves.
25<br />
Climate change projections for the XXI century over the Iberian peninsula<br />
using dynamic downscaling<br />
J.J. Gómez-Navarro, J.P. Montávez, S. Jerez and P. Jiménez-Guerrero<br />
Departamento de Física, Universidad de Murcia, Edificio CIOyN, Campus de Espinardo, 30100, Spain.<br />
(jjgomeznavarro@um.es)<br />
1. Introduction<br />
Climate change is one of the most concerned problems in<br />
the actual society, as pointed by the last report of the IPCC<br />
(IPCC, 2007). Specifically, the Iberian Peninsula (IP), as<br />
part of the Mediterranean Region, has been identified as one<br />
of the most responsive regions to climate change (Giorgi,<br />
2006; Diffenbaugh et al., 2007).<br />
Due to its orographic complexity, the IP has many different<br />
climates, and a good spatial resolution is needed to<br />
understand the details and possible effects of climate<br />
change. Nevertheless, the Global Circulation Models (GCM)<br />
have a too coarse resolution which makes them unfeasible to<br />
study climate change implications over the IP.<br />
4. Results<br />
The spatial structure of the patterns and their temporal<br />
evolution have been studied separately.<br />
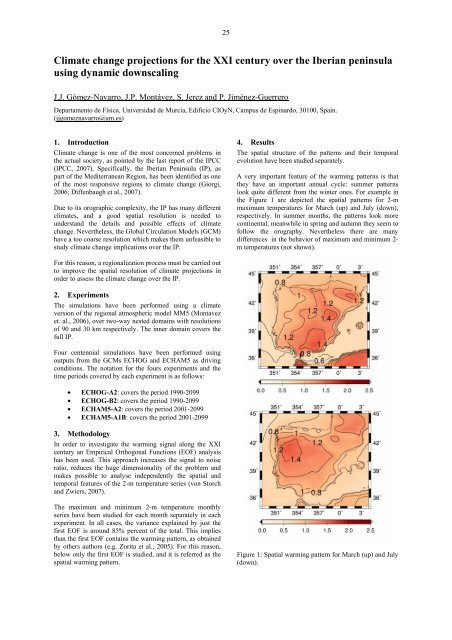
A very important feature of the warming patterns is that<br />
they have an important annual cycle: summer patterns<br />
look quite different from the winter ones. For example in<br />
the Figure 1 are depicted the spatial patterns for 2-m<br />
maximum temperatures for March (up) and July (down),<br />
respectively. In summer months, the patterns look more<br />
continental, meanwhile in spring and autumn they seem to<br />
follow the orography. Nevertheless there are many<br />
differences in the behavior of maximum and minimum 2-<br />
m temperatures (not shown).<br />
For this reason, a regionalization process must be carried out<br />
to improve the spatial resolution of climate projections in<br />
order to assess the climate change over the IP.<br />
2. Experiments<br />
The simulations have been performed using a climate<br />
version of the regional atmospheric model MM5 (Montavez<br />
et. al., 2006), over two-way nested domains with resolutions<br />
of 90 and 30 km respectively. The inner domain covers the<br />
full IP.<br />
Four centennial simulations have been performed using<br />
outputs from the GCMs ECHOG and ECHAM5 as driving<br />
conditions. The notation for the fours experiments and the<br />
time periods covered by each experiment is as follows:<br />
• ECHOG-A2: covers the period 1990-2099<br />
• ECHOG-B2: covers the period 1990-2099<br />
• ECHAM5-A2: covers the period 2001-2099<br />
• ECHAM5-A1B: covers the period 2001-2099<br />
3. Methodology<br />
In order to investigate the warming signal along the XXI<br />
century an Empirical Orthogonal Functions (EOF) analysis<br />
has been used. This approach increases the signal to noise<br />
ratio, reduces the huge dimensionality of the problem and<br />
makes possible to analyse independently the spatial and<br />
temporal features of the 2-m temperature series (von Storch<br />
and Zwiers, 2007).<br />
The maximum and minimum 2-m temperature monthly<br />
series have been studied for each month separately in each<br />
experiment. In all cases, the variance explained by just the<br />
first EOF is around 85% percent of the total. This implies<br />
than the first EOF contains the warming pattern, as obtained<br />
by others authors (e.g. Zorita et al., 2005). For this reason,<br />
below only the first EOF is studied, and it is referred as the<br />
spatial warming pattern.<br />
Figure 1: Spatial warming pattern for March (up) and July<br />
(down).


