

Low (web) Quality - BALTEX
Low (web) Quality - BALTEX
Low (web) Quality - BALTEX

Create successful ePaper yourself
Turn your PDF publications into a flip-book with our unique Google optimized e-Paper software.
3<br />
A comparison of RCM performance for eastern Baltic region and the<br />
application of histogram equalization method for RCM outputs<br />
Uldis Bethers, Juris Seņņikovs and Andrejs Timuhins<br />
Faculty of Physics and Mathematics, University of Latvia, 8 Zeļļu street, Riga LV1002, Latvia. bethers@latnet.lv<br />
1. Introduction<br />
The intention of this work was the building of the climate<br />
data sets for the territory of Latvia, i.e. the eastern Baltic<br />
region. The required data sets were at least temperature and<br />
precipitation time series with reasonable spatial resolution<br />
which might be considered as characteristic for<br />
contemporary climate and climate change scenarios B2 and<br />
A2. The further usage of the data series (not covered in this<br />
abstract) was foreseen for the assessment of the impact of<br />
the climate change on the Latvian inland and coastal water<br />
environment.<br />
Authors considered the set of RCM computations publicly<br />
available within the framework of PRUDENCE project. The<br />
method of comparison of RCM calculation results with the<br />
observed data series was proposed. The considered RCMs<br />
were ranked according to this comparison. The typical<br />
discrepancies between the modeled and observed<br />
temperature and precipitation data series were revealed. The<br />
method of the histogram equalization was proposed allowing<br />
processing of the RCM output, and yielding data series<br />
which statistically does not differed from the observed data<br />
series for the control time period (contemporary climate).<br />
The correction method was applied also for RCM<br />
calculations of B2 and A2 cliamate scenarios.<br />
2. Comparison RCM vs. Observations<br />
We considered the collection of the RCM calculations<br />
organised in a <strong>web</strong>-accessible database at Danish<br />
Meteorological Institute under EC 5th FP research project<br />
“PRUDENCE” EVK2-CT2001-00132 (prudence.dmi.dk).<br />
We considered 21 different model for the control period<br />
1961-1991 characterising the contemporary climate. The<br />
observations of air temperature and precipitation by Soviet<br />
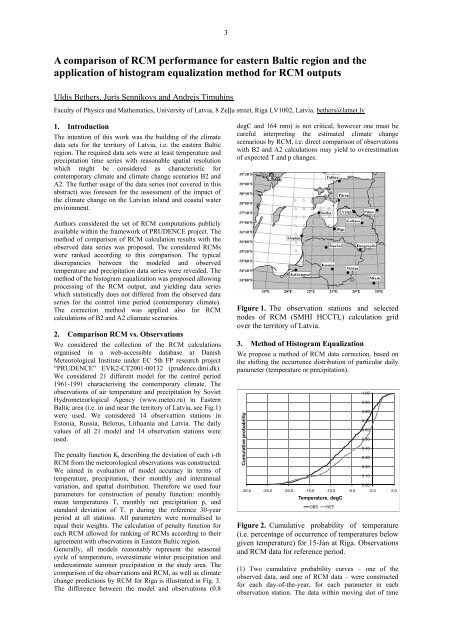
Hydrometeorlogical Agency (www.meteo.ru) in Eastern<br />
Baltic area (i.e. in and near the territory of Latvia, see Fig.1)<br />
were used. We conisdered 14 observattion stations in<br />
Estonia, Russia, Belorus, Lithuania and Latvia. The daily<br />
values of all 21 model and 14 observation stations were<br />
used.<br />
The penalty function K i describing the deviation of each i-th<br />
RCM from the meteorological observations was constructed.<br />
We aimed in evaluation of model accuracy in terms of<br />
temperature, precipitation, their monthly and interannual<br />
variation, and spatial distribution. Therefore we used four<br />
parameters for construction of penalty function: monthly<br />
mean temperatures T, monthly net precipitation p, and<br />
standard deviation of T, p during the reference 30-year<br />
period at all stations. All parameters were normalised to<br />
equal their weights. The calculation of penalty function for<br />
each RCM allowed for ranking of RCMs according to their<br />
agreement with observations in Eastern Baltic region.<br />
Generally, all models reasonably represent the seasonal<br />
cycle of temperature, overestimate winter precipitation and<br />
underestimate summer precipitation in the study area. The<br />
comparison of the observations and RCM, as well as climate<br />
change predictions by RCM for Riga is illustrated in Fig. 3.<br />
The difference between the model and observations (0.8<br />
degC and 164 mm) is not critical, however one must be<br />
careful interpreting the estimated climate change<br />
scenarious by RCM, i.e. direct comparison of observations<br />
with B2 and A2 calculations may yield to overestimation<br />
of expected T and p changes.<br />
Figure 1. The observation stations and selected<br />
nodes of RCM (SMHI HCCTL) calculation grid<br />
over the territory of Latvia.<br />
3. Method of Histogram Equalization<br />
We propose a method of RCM data correction, based on<br />
the shifting the occurrence distribution of particular daily<br />
parameter (temperature or precipitation).<br />
Cumulative probability<br />
0.00<br />
-30.0 -25.0 -20.0 -15.0 -10.0 -5.0 0.0 5.0<br />
Temperature, degC<br />
OBS REF<br />
Figure 2. Cumulative probability of temperature<br />
(i.e. percentage of occurrence of temperatures below<br />
given temperature) for 15-Jan at Riga. Observations<br />
and RCM data for reference period.<br />
(1) Two cumulative probability curves – one of the<br />
observed data, and one of RCM data – were constructed<br />
for each day-of-the-year, for each parameter in each<br />
observation station. The data within moving slot of time<br />
1.00<br />
0.90<br />
0.80<br />
0.70<br />
0.60<br />
0.50<br />
0.40<br />
0.30<br />
0.20<br />
0.10


