

Low (web) Quality - BALTEX
Low (web) Quality - BALTEX
Low (web) Quality - BALTEX

Create successful ePaper yourself
Turn your PDF publications into a flip-book with our unique Google optimized e-Paper software.
176<br />
Current-climate downscaling of winds and precipitation for the<br />
Eastern Mediterranean<br />
Scott Swerdlin 1 , Thomas Warner 1 , Andrea Hahmann 2 , Dorita Rostkier-Edelstein 3 and Yubao<br />
Liu 1<br />
1 National Center for Atmospheric Research, Boulder, Colorado,USA; swerdlin@ucar.edu<br />
2 Risø National Laboratory for Sustainable Energy, Technical University of Denmark<br />
3 Israel Institute of Biological Research, Ness-Ziona, Israel<br />
1. Introduction<br />
The use of a four-dimensional data-assimilation<br />
(FDDA) system for generating mesoscale<br />
climatographies is demonstrated. This dynamical<br />
downscaling method utilizes the Penn State<br />
University – National Center for Atmospheric<br />
Research Mesoscale Model Version 5 (MM5),<br />
wherein Newtonian-relaxation terms in the<br />
prognostic equations continually nudge the model<br />
solution toward surface and upper-air observations.<br />
When applied for mesoscale climatography<br />
development, the system is called Climate-FDDA<br />
(CFDDA). In this example application of CFDDA,<br />
it is used to downscale weather in the Eastern<br />
Mediterranean region for January and July. This<br />
region was chosen because of its interesting weather<br />
and climate (e.g., geographic contrasts, inter-annual<br />
and inter-seasonal variability).<br />
We verify the performance of the downscaling<br />
method by using independent gridded observations<br />
of monthly rainfall, QuikSCAT ocean-surface<br />
winds, TRMM and gauge rainfall, and hourly<br />
boundary-layer winds from near-coastal tall-tower<br />
sites. The verification focuses on the ability of the<br />
mesoscale model to represent the frequency<br />
distributions of atmospheric states, rather than the<br />
simple zero-order statistics. Earlier results for this<br />
study are published in Hahmann et al. (2007).<br />
2. The model configuration<br />
The model uses 36 computational levels, with<br />
approximately 12 levels within the lowest 1 km and<br />
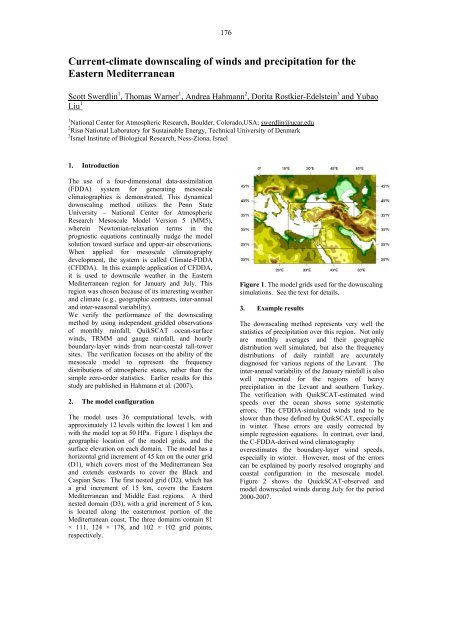
with the model top at 50 HPa. Figure 1 displays the<br />
geographic location of the model grids, and the<br />
surface elevation on each domain. The model has a<br />
horizontal grid increment of 45 km on the outer grid<br />
(D1), which covers most of the Mediterranean Sea<br />
and extends eastwards to cover the Black and<br />
Caspian Seas. The first nested grid (D2), which has<br />
a grid increment of 15 km, covers the Eastern<br />
Mediterranean and Middle East regions. A third<br />
nested domain (D3), with a grid increment of 5 km,<br />
is located along the easternmost portion of the<br />
Mediterranean coast. The three domains contain 81<br />
× 111, 124 × 178, and 102 × 102 grid points,<br />
respectively.<br />
Figure 1. The model grids used for the downscaling<br />
simulations. See the text for details.<br />
3. Example results<br />
The downscaling method represents very well the<br />
statistics of precipitation over this region. Not only<br />
are monthly averages and their geographic<br />
distribution well simulated, but also the frequency<br />
distributions of daily rainfall are accurately<br />
diagnosed for various regions of the Levant. The<br />
inter-annual variability of the January rainfall is also<br />
well represented for the regions of heavy<br />
precipitation in the Levant and southern Turkey.<br />
The verification with QuikSCAT-estimated wind<br />
speeds over the ocean shows some systematic<br />
errors. The CFDDA-simulated winds tend to be<br />
slower than those defined by QuikSCAT, especially<br />
in winter. These errors are easily corrected by<br />
simple regression equations. In contrast, over land,<br />
the C-FDDA-derived wind climatography<br />
overestimates the boundary-layer wind speeds,<br />
especially in winter. However, most of the errors<br />
can be explained by poorly resolved orography and<br />
coastal configuration in the mesoscale model.<br />
Figure 2 shows the QuickSCAT-observed and<br />
model downscaled winds during July for the period<br />
2000-2007.


