

Low (web) Quality - BALTEX
Low (web) Quality - BALTEX
Low (web) Quality - BALTEX

You also want an ePaper? Increase the reach of your titles
YUMPU automatically turns print PDFs into web optimized ePapers that Google loves.
21<br />
The higher spatial resolution, compared to the driving largescale<br />
data, will in general not improve the representation of<br />
the large-scale dynamics, but presumably mostly the mesoscale<br />
dynamics. This can be demonstrated by comparing<br />
statistics of meso-scale dynamics simulated in extended<br />
RCM simulations with operational regional weather<br />
analyses. To do so, suitable digital spatial filters are needed<br />
(Feser and von Storch (2005)). It turns out that regional<br />
models show an added value in describing meso-scale<br />
variability compared to the driving global reanalysis, in<br />
particular, when the RCM is constrained at the large spatial<br />
scales (Feser (2006)). Not unexpectedly, the description of<br />
the large scales is slightly deteriorated.<br />
The higher resolved description of physiographic details,<br />
such as mountain ranges, coastal zones and details of soil<br />
properties has the potential of describing the weather and its<br />
statistics in such regions closer to reality than the global<br />
analyses or simulations. By comparing RCM simulated data<br />
with QuikSCAT satellite and with local buoy data,<br />
Winterfeldt and Weisse (2009) demonstrated that the usage<br />
of RCMs indeed leads to an advanced description of wind<br />
speed statistics in coastal seas, while conditions in the open<br />
ocean were not improved (Fig. 3).<br />
Finally, an important utility of such multi-decadal model<br />
data is that they may be used to quantitatively describe<br />
hazards and changing conditions in the regional Earth<br />
System – examples are the hydrodynamics of marginal<br />
seas, in particular currents, sea level, and thus storm<br />
surges or ocean wave conditions and related hazards<br />
(CoastDat; Weisse et al. (2009)).<br />
References<br />
Feser, F. and H. von Storch, Regional modelling of the<br />
western Pacific typhoon season 2004, Meteorolog. Z., 17,<br />
4, pp. 519-528, 2008<br />
Feser, F., Enhanced detectability of added value in limited<br />
area model results separated into different spatial scales,<br />
Mon. Wea. Rev., 134, 8, pp. 2180-2190, 2006<br />
Feser, F., and H. von Storch, A spatial two-dimensional<br />
discrete filter for limited area model evaluation purposes,<br />
Mon. Wea. Rev., 133, 6, pp. 1774-1786, 2005<br />
Rockel, B., C. L. Castro, R. A. Pielke Sr., H. von Storch,<br />
G. Lencini, Dynamical Downscaling: Assessment of<br />
Model System Dependent Retained and Added Variability<br />
for two Different Regional Climate Models, J. Geophys.<br />
Res., 113, D21107, doi:10.1029/2007JD009461, 2008<br />
von Storch, H., H. Langenberg, and F. Feser, A Spectral<br />
Nudging Technique for Dynamical Downscaling<br />
Purposes, Mon. Wea. Rev., 128, 10, pp. 3664-3673, 2000<br />
Weisse, R., H. von Storch, U. Callies, A. Chrastansky, F.<br />
Feser, I. Grabemann, H. Guenther, A. Pluess, T. Stoye, J.<br />
Tellkamp, J. Winterfeldt and K. Woth, Regional meteomarine<br />
reanalyses and climate change projections: Results<br />
for Northern Europe and potentials for coastal and<br />
offshore applications, Bull. Amer. Meteor. Soc., in press,<br />
2009<br />
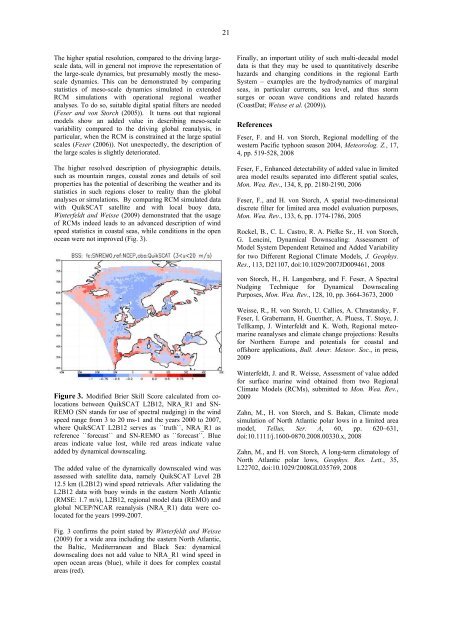
Figure 3. Modified Brier Skill Score calculated from colocations<br />
between QuikSCAT L2B12, NRA_R1 and SN-<br />
REMO (SN stands for use of spectral nudging) in the wind<br />
speed range from 3 to 20 ms-1 and the years 2000 to 2007,<br />
where QuikSCAT L2B12 serves as ``truth``, NRA_R1 as<br />
reference ``forecast`` and SN-REMO as ``forecast``. Blue<br />
areas indicate value lost, while red areas indicate value<br />
added by dynamical downscaling.<br />
The added value of the dynamically downscaled wind was<br />
assessed with satellite data, namely QuikSCAT Level 2B<br />
12.5 km (L2B12) wind speed retrievals. After validating the<br />
L2B12 data with buoy winds in the eastern North Atlantic<br />
(RMSE: 1.7 m/s), L2B12, regional model data (REMO) and<br />
global NCEP/NCAR reanalysis (NRA_R1) data were colocated<br />
for the years 1999-2007.<br />
Winterfeldt, J. and R. Weisse, Assessment of value added<br />
for surface marine wind obtained from two Regional<br />
Climate Models (RCMs), submitted to Mon. Wea. Rev.,<br />
2009<br />
Zahn, M., H. von Storch, and S. Bakan, Climate mode<br />
simulation of North Atlantic polar lows in a limited area<br />
model, Tellus, Ser. A, 60, pp. 620–631,<br />
doi:10.1111/j.1600-0870.2008.00330.x, 2008<br />
Zahn, M., and H. von Storch, A long-term climatology of<br />
North Atlantic polar lows, Geophys. Res. Lett., 35,<br />
L22702, doi:10.1029/2008GL035769, 2008<br />
Fig. 3 confirms the point stated by Winterfeldt and Weisse<br />
(2009) for a wide area including the eastern North Atlantic,<br />
the Baltic, Mediterranean and Black Sea: dynamical<br />
downscaling does not add value to NRA_R1 wind speed in<br />
open ocean areas (blue), while it does for complex coastal<br />
areas (red).


