- Page 1:
Actuarial Modelling of Claim Counts
- Page 5 and 6:
Actuarial Modelling of Claim Counts
- Page 7 and 8:
Contents Foreword Preface Notation
- Page 9 and 10:
Contents vii 2.4 Overdispersion 79
- Page 11 and 12:
Contents ix 4.2.3 Trajectory 170 4.
- Page 13:
Contents xi 7.4 Numerical Illustrat
- Page 16 and 17:
xiv Actuarial Modelling of Claim Co
- Page 18 and 19:
xvi Actuarial Modelling of Claim Co
- Page 20 and 21:
xviii Actuarial Modelling of Claim
- Page 22 and 23:
xx Actuarial Modelling of Claim Cou
- Page 24 and 25:
xxii Actuarial Modelling of Claim C
- Page 26 and 27:
xxiv Actuarial Modelling of Claim C
- Page 28 and 29:
xxvi Actuarial Modelling of Claim C
- Page 31:
Part I Modelling Claim Counts Actua
- Page 34 and 35:
4 Actuarial Modelling of Claim Coun
- Page 36 and 37:
6 Actuarial Modelling of Claim Coun
- Page 38 and 39:
8 Actuarial Modelling of Claim Coun
- Page 40 and 41:
10 Actuarial Modelling of Claim Cou
- Page 42 and 43:
12 Actuarial Modelling of Claim Cou
- Page 44 and 45:
14 Actuarial Modelling of Claim Cou
- Page 46 and 47:
16 Actuarial Modelling of Claim Cou
- Page 48 and 49:
18 Actuarial Modelling of Claim Cou
- Page 50 and 51:
20 Actuarial Modelling of Claim Cou
- Page 52 and 53:
22 Actuarial Modelling of Claim Cou
- Page 54 and 55:
24 Actuarial Modelling of Claim Cou
- Page 56 and 57:
26 Actuarial Modelling of Claim Cou
- Page 58 and 59:
28 Actuarial Modelling of Claim Cou
- Page 60 and 61:
30 Actuarial Modelling of Claim Cou
- Page 62 and 63:
32 Actuarial Modelling of Claim Cou
- Page 64 and 65:
34 Actuarial Modelling of Claim Cou
- Page 66 and 67:
36 Actuarial Modelling of Claim Cou
- Page 68 and 69:
38 Actuarial Modelling of Claim Cou
- Page 70 and 71:
40 Actuarial Modelling of Claim Cou
- Page 72 and 73:
42 Actuarial Modelling of Claim Cou
- Page 74 and 75:
44 Actuarial Modelling of Claim Cou
- Page 76 and 77:
46 Actuarial Modelling of Claim Cou
- Page 78 and 79:
48 Actuarial Modelling of Claim Cou
- Page 80 and 81:
50 Actuarial Modelling of Claim Cou
- Page 82 and 83:
52 Actuarial Modelling of Claim Cou
- Page 84 and 85:
54 Actuarial Modelling of Claim Cou
- Page 86 and 87:
56 Actuarial Modelling of Claim Cou
- Page 88 and 89:
58 Actuarial Modelling of Claim Cou
- Page 90 and 91:
60 Actuarial Modelling of Claim Cou
- Page 92 and 93:
62 Actuarial Modelling of Claim Cou
- Page 94 and 95:
64 Actuarial Modelling of Claim Cou
- Page 96 and 97:
66 Actuarial Modelling of Claim Cou
- Page 98 and 99:
68 Actuarial Modelling of Claim Cou
- Page 100 and 101:
70 Actuarial Modelling of Claim Cou
- Page 102 and 103:
72 Actuarial Modelling of Claim Cou
- Page 104 and 105:
74 Actuarial Modelling of Claim Cou
- Page 106 and 107:
76 Actuarial Modelling of Claim Cou
- Page 108 and 109:
78 Actuarial Modelling of Claim Cou
- Page 110 and 111:
80 Actuarial Modelling of Claim Cou
- Page 112 and 113:
82 Actuarial Modelling of Claim Cou
- Page 114 and 115:
84 Actuarial Modelling of Claim Cou
- Page 116 and 117:
86 Actuarial Modelling of Claim Cou
- Page 118 and 119:
88 Actuarial Modelling of Claim Cou
- Page 120 and 121:
90 Actuarial Modelling of Claim Cou
- Page 122 and 123:
92 Actuarial Modelling of Claim Cou
- Page 124 and 125:
94 Actuarial Modelling of Claim Cou
- Page 126 and 127:
96 Actuarial Modelling of Claim Cou
- Page 128 and 129:
98 Actuarial Modelling of Claim Cou
- Page 130 and 131:
100 Actuarial Modelling of Claim Co
- Page 132 and 133:
102 Actuarial Modelling of Claim Co
- Page 134 and 135:
104 Actuarial Modelling of Claim Co
- Page 136 and 137:
106 Actuarial Modelling of Claim Co
- Page 138 and 139:
108 Actuarial Modelling of Claim Co
- Page 140 and 141:
110 Actuarial Modelling of Claim Co
- Page 142 and 143:
112 Actuarial Modelling of Claim Co
- Page 144 and 145:
114 Actuarial Modelling of Claim Co
- Page 146 and 147:
116 Actuarial Modelling of Claim Co
- Page 148 and 149:
118 Actuarial Modelling of Claim Co
- Page 151 and 152:
3 Credibility Models for Claim Coun
- Page 153 and 154:
Credibility Models for Claim Counts
- Page 155 and 156:
Credibility Models for Claim Counts
- Page 157 and 158:
Credibility Models for Claim Counts
- Page 159 and 160:
Credibility Models for Claim Counts
- Page 161 and 162:
Credibility Models for Claim Counts
- Page 163 and 164:
Credibility Models for Claim Counts
- Page 165 and 166:
Credibility Models for Claim Counts
- Page 167 and 168:
Credibility Models for Claim Counts
- Page 169 and 170:
Credibility Models for Claim Counts
- Page 171 and 172:
Credibility Models for Claim Counts
- Page 173 and 174:
Credibility Models for Claim Counts
- Page 175 and 176:
Credibility Models for Claim Counts
- Page 177 and 178:
Credibility Models for Claim Counts
- Page 179 and 180:
Credibility Models for Claim Counts
- Page 181 and 182:
Credibility Models for Claim Counts
- Page 183 and 184:
Credibility Models for Claim Counts
- Page 185 and 186:
Credibility Models for Claim Counts
- Page 187 and 188:
Credibility Models for Claim Counts
- Page 189 and 190:
Credibility Models for Claim Counts
- Page 191 and 192:
Credibility Models for Claim Counts
- Page 193:
Credibility Models for Claim Counts
- Page 196 and 197:
166 Actuarial Modelling of Claim Co
- Page 198 and 199:
168 Actuarial Modelling of Claim Co
- Page 200 and 201:
170 Actuarial Modelling of Claim Co
- Page 202 and 203:
172 Actuarial Modelling of Claim Co
- Page 204 and 205:
174 Actuarial Modelling of Claim Co
- Page 206 and 207:
176 Actuarial Modelling of Claim Co
- Page 208 and 209:
178 Actuarial Modelling of Claim Co
- Page 210 and 211:
180 Actuarial Modelling of Claim Co
- Page 212 and 213:
182 Actuarial Modelling of Claim Co
- Page 214 and 215:
184 Actuarial Modelling of Claim Co
- Page 216 and 217:
186 Actuarial Modelling of Claim Co
- Page 218 and 219:
188 Actuarial Modelling of Claim Co
- Page 220 and 221:
190 Actuarial Modelling of Claim Co
- Page 222 and 223:
192 Actuarial Modelling of Claim Co
- Page 224 and 225:
194 Actuarial Modelling of Claim Co
- Page 226 and 227:
196 Actuarial Modelling of Claim Co
- Page 228 and 229:
198 Actuarial Modelling of Claim Co
- Page 230 and 231:
200 Actuarial Modelling of Claim Co
- Page 232 and 233:
202 Actuarial Modelling of Claim Co
- Page 234 and 235:
204 Actuarial Modelling of Claim Co
- Page 236 and 237:
206 Actuarial Modelling of Claim Co
- Page 238 and 239:
208 Actuarial Modelling of Claim Co
- Page 240 and 241:
210 Actuarial Modelling of Claim Co
- Page 242 and 243:
212 Actuarial Modelling of Claim Co
- Page 244 and 245:
214 Actuarial Modelling of Claim Co
- Page 247:
Part III Advances in Experience Rat
- Page 250 and 251:
220 Actuarial Modelling of Claim Co
- Page 252 and 253:
222 Actuarial Modelling of Claim Co
- Page 254 and 255:
224 Actuarial Modelling of Claim Co
- Page 256 and 257:
226 Actuarial Modelling of Claim Co
- Page 258 and 259:
228 Actuarial Modelling of Claim Co
- Page 260 and 261:
230 Actuarial Modelling of Claim Co
- Page 262 and 263:
232 Actuarial Modelling of Claim Co
- Page 264 and 265:
234 Actuarial Modelling of Claim Co
- Page 266 and 267:
236 Actuarial Modelling of Claim Co
- Page 268 and 269:
238 Actuarial Modelling of Claim Co
- Page 270 and 271:
240 Actuarial Modelling of Claim Co
- Page 272 and 273:
242 Actuarial Modelling of Claim Co
- Page 274 and 275:
244 Actuarial Modelling of Claim Co
- Page 276 and 277:
246 Actuarial Modelling of Claim Co
- Page 278 and 279:
248 Actuarial Modelling of Claim Co
- Page 280 and 281:
250 Actuarial Modelling of Claim Co
- Page 282 and 283:
252 Actuarial Modelling of Claim Co
- Page 284 and 285:
254 Actuarial Modelling of Claim Co
- Page 286 and 287:
256 Actuarial Modelling of Claim Co
- Page 288 and 289:
258 Actuarial Modelling of Claim Co
- Page 290 and 291:
260 Actuarial Modelling of Claim Co
- Page 292 and 293: 262 Actuarial Modelling of Claim Co
- Page 294 and 295: 264 Actuarial Modelling of Claim Co
- Page 296 and 297: 266 Actuarial Modelling of Claim Co
- Page 298 and 299: 268 Actuarial Modelling of Claim Co
- Page 300 and 301: 270 Actuarial Modelling of Claim Co
- Page 302 and 303: 272 Actuarial Modelling of Claim Co
- Page 304 and 305: 274 Actuarial Modelling of Claim Co
- Page 306 and 307: 276 Actuarial Modelling of Claim Co
- Page 308 and 309: 278 Actuarial Modelling of Claim Co
- Page 310 and 311: 280 Actuarial Modelling of Claim Co
- Page 312 and 313: 282 Actuarial Modelling of Claim Co
- Page 314 and 315: 284 Actuarial Modelling of Claim Co
- Page 316 and 317: 286 Actuarial Modelling of Claim Co
- Page 318 and 319: 288 Actuarial Modelling of Claim Co
- Page 320 and 321: 290 Actuarial Modelling of Claim Co
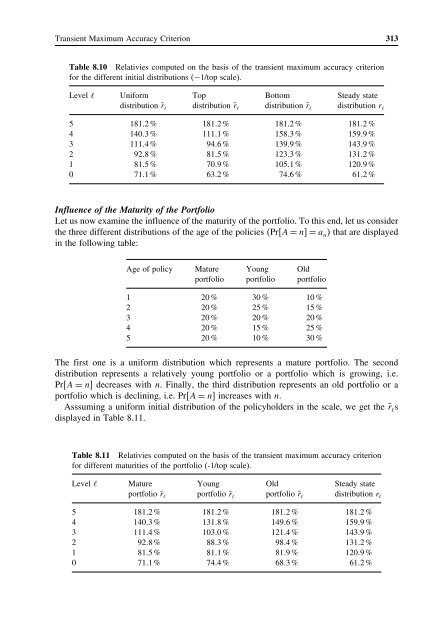
- Page 323 and 324: 8 Transient Maximum Accuracy Criter
- Page 325 and 326: Transient Maximum Accuracy Criterio
- Page 327 and 328: Transient Maximum Accuracy Criterio
- Page 329 and 330: Transient Maximum Accuracy Criterio
- Page 331 and 332: Transient Maximum Accuracy Criterio
- Page 333 and 334: Transient Maximum Accuracy Criterio
- Page 335 and 336: Transient Maximum Accuracy Criterio
- Page 337 and 338: Transient Maximum Accuracy Criterio
- Page 339 and 340: Transient Maximum Accuracy Criterio
- Page 341: Transient Maximum Accuracy Criterio
- Page 345 and 346: Transient Maximum Accuracy Criterio
- Page 347 and 348: Transient Maximum Accuracy Criterio
- Page 349 and 350: Transient Maximum Accuracy Criterio
- Page 351 and 352: Transient Maximum Accuracy Criterio
- Page 353: Transient Maximum Accuracy Criterio
- Page 356 and 357: 326 Actuarial Modelling of Claim Co
- Page 358 and 359: 328 Actuarial Modelling of Claim Co
- Page 360 and 361: 330 Actuarial Modelling of Claim Co
- Page 362 and 363: 332 Actuarial Modelling of Claim Co
- Page 364 and 365: 334 Actuarial Modelling of Claim Co
- Page 366 and 367: 336 Actuarial Modelling of Claim Co
- Page 368 and 369: 338 Actuarial Modelling of Claim Co
- Page 370 and 371: 340 Actuarial Modelling of Claim Co
- Page 372 and 373: 342 Actuarial Modelling of Claim Co
- Page 375 and 376: Bibliography Albrecht, P. (1983a).
- Page 377 and 378: Bibliography 347 Daengdej, J., Luko
- Page 379 and 380: Bibliography 349 Greenwood, M., & Y
- Page 381 and 382: Bibliography 351 Norberg, R. (1976)
- Page 383: Bibliography 353 Walhin, J.-F., & P
- Page 386: 356 Actuarial Modelling of Claim Co