- Page 3:
Economic Assessment ofSanitation In
- Page 9:
Economic Assessment of Sanitation I
- Page 12 and 13:
Economic Assessment of Sanitation I
- Page 14 and 15:
Economic Assessment of Sanitation I
- Page 17:
ForewordTarget 10 of the Millennium
- Page 22 and 23:
Glossary of TermsBenefit-cost ratio
- Page 24 and 25:
AcknowledgmentsThe Economics of San
- Page 27 and 28:
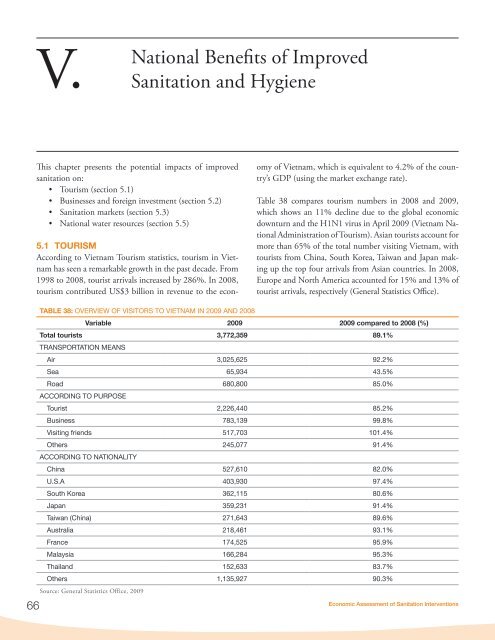
V. National Benefits of Improved Sa
- Page 29 and 30:
Table 32. Sanitation coverage, and
- Page 31:
Figure 34. What factors were of mos
- Page 34 and 35:
Annex Table E1. Level of satisfacti
- Page 36 and 37:
Annex Table J1. Site U1 (Dong Thap,
- Page 38 and 39:
PopulationSelected Development Indi
- Page 40 and 41:
Economic Assessment of Sanitation I
- Page 42 and 43:
Economic Assessment of Sanitation I
- Page 44 and 45:
Economic Assessment of Sanitation I
- Page 46 and 47:
III.Study MethodsThe study methodol
- Page 48 and 49:
Economic Assessment of Sanitation I
- Page 50 and 51:
Economic Assessment of Sanitation I
- Page 52 and 53:
Economic Assessment of Sanitation I
- Page 54 and 55: Economic Assessment of Sanitation I
- Page 56 and 57: Economic Assessment of Sanitation I
- Page 58 and 59: Economic Assessment of Sanitation I
- Page 60: Economic Assessment of Sanitation I
- Page 64 and 65: Economic Assessment of Sanitation I
- Page 66 and 67: Economic Assessment of Sanitation I
- Page 68 and 69: Economic Assessment of Sanitation I
- Page 70 and 71: IV.Local Benefits of Improved Sanit
- Page 72 and 73: Economic Assessment of Sanitation I
- Page 74 and 75: Economic Assessment of Sanitation I
- Page 76 and 77: Economic Assessment of Sanitation I
- Page 78 and 79: Economic Assessment of Sanitation I
- Page 80 and 81: Economic Assessment of Sanitation I
- Page 83 and 84: Economic Assessment of Sanitation I
- Page 85 and 86: Economic Assessment of Sanitation I
- Page 87 and 88: Economic Assessment of Sanitation I
- Page 89 and 90: Economic Assessment of Sanitation I
- Page 91 and 92: Economic Assessment of Sanitation I
- Page 93 and 94: Economic Assessment of Sanitation I
- Page 95 and 96: Economic Assessment of Sanitation I
- Page 97 and 98: Economic Assessment of Sanitation I
- Page 99 and 100: Economic Assessment of Sanitation I
- Page 101 and 102: Economic Assessment of Sanitation I
- Page 103: Economic Assessment of Sanitation I
- Page 107 and 108: Economic Assessment of Sanitation I
- Page 109 and 110: Economic Assessment of Sanitation I
- Page 111 and 112: Economic Assessment of Sanitation I
- Page 113 and 114: Economic Assessment of Sanitation I
- Page 115 and 116: Economic Assessment of Sanitation I
- Page 117 and 118: VI.Costs of Improved Sanitationand
- Page 119 and 120: Economic Assessment of Sanitation I
- Page 121 and 122: Economic Assessment of Sanitation I
- Page 123 and 124: Economic Assessment of Sanitation I
- Page 125 and 126: Economic Assessment of Sanitation I
- Page 127: Economic Assessment of Sanitation I
- Page 130 and 131: Economic Assessment of Sanitation I
- Page 132 and 133: Economic Assessment of Sanitation I
- Page 134 and 135: Economic Assessment of Sanitation I
- Page 137 and 138: Economic Assessment of Sanitation I
- Page 139 and 140: Economic Assessment of Sanitation I
- Page 141 and 142: Economic Assessment of Sanitation I
- Page 143 and 144: Economic Assessment of Sanitation I
- Page 145 and 146: Economic Assessment of Sanitation I
- Page 147 and 148: Economic Assessment of Sanitation I
- Page 149 and 150: ReferencesAcharya A, Paunio MK and
- Page 152 and 153: ANNEX 1: PROGRAM APPROACH ANALYSIST
- Page 154 and 155:
Economic Assessment of Sanitation I
- Page 156 and 157:
Economic Assessment of Sanitation I
- Page 158 and 159:
Economic Assessment of Sanitation I
- Page 160 and 161:
Economic Assessment of Sanitation I
- Page 162 and 163:
Economic Assessment of Sanitation I
- Page 164 and 165:
Economic Assessment of Sanitation I
- Page 166 and 167:
ANNEX TABLESANNEX A. STUDY METHODST
- Page 168 and 169:
Economic Assessment of Sanitation I
- Page 170 and 171:
Economic Assessment of Sanitation I
- Page 172 and 173:
Economic Assessment of Sanitation I
- Page 174 and 175:
Economic Assessment of Sanitation I
- Page 176 and 177:
Economic Assessment of Sanitation I
- Page 178 and 179:
Economic Assessment of Sanitation I
- Page 180 and 181:
Economic Assessment of Sanitation I
- Page 182 and 183:
Economic Assessment of Sanitation I
- Page 184 and 185:
Economic Assessment of Sanitation I
- Page 187 and 188:
Economic Assessment of Sanitation I
- Page 189 and 190:
Economic Assessment of Sanitation I
- Page 191 and 192:
Economic Assessment of Sanitation I
- Page 193 and 194:
Economic Assessment of Sanitation I
- Page 195 and 196:
Economic Assessment of Sanitation I
- Page 197 and 198:
Economic Assessment of Sanitation I
- Page 199 and 200:
Economic Assessment of Sanitation I
- Page 201 and 202:
Economic Assessment of Sanitation I
- Page 203 and 204:
Economic Assessment of Sanitation I
- Page 205 and 206:
Economic Assessment of Sanitation I
- Page 207 and 208:
Economic Assessment of Sanitation I
- Page 209 and 210:
Economic Assessment of Sanitation I
- Page 211 and 212:
Economic Assessment of Sanitation I
- Page 213 and 214:
Economic Assessment of Sanitation I
- Page 215 and 216:
Economic Assessment of Sanitation I
- Page 217 and 218:
Economic Assessment of Sanitation I
- Page 219:
Economic Assessment of Sanitation I
- Page 222 and 223:
Economic Assessment of Sanitation I
- Page 224 and 225:
Economic Assessment of Sanitation I
- Page 226 and 227:
Economic Assessment of Sanitation I
- Page 228 and 229:
Economic Assessment of Sanitation I
- Page 230 and 231:
Economic Assessment of Sanitation I
- Page 232 and 233:
Economic Assessment of Sanitation I
- Page 234 and 235:
Economic Assessment of Sanitation I
- Page 236 and 237:
Economic Assessment of Sanitation I
- Page 238 and 239:
Economic Assessment of Sanitation I
- Page 240 and 241:
Economic Assessment of Sanitation I
- Page 242 and 243:
Economic Assessment of Sanitation I
- Page 244 and 245:
Economic Assessment of Sanitation I
- Page 246 and 247:
Economic Assessment of Sanitation I
- Page 248 and 249:
Economic Assessment of Sanitation I
- Page 250 and 251:
Economic Assessment of Sanitation I
- Page 252 and 253:
Economic Assessment of Sanitation I
- Page 254:
Economic Assessment of Sanitation I
- Page 257 and 258:
Economic Assessment of Sanitation I
- Page 259 and 260:
Economic Assessment of Sanitation I