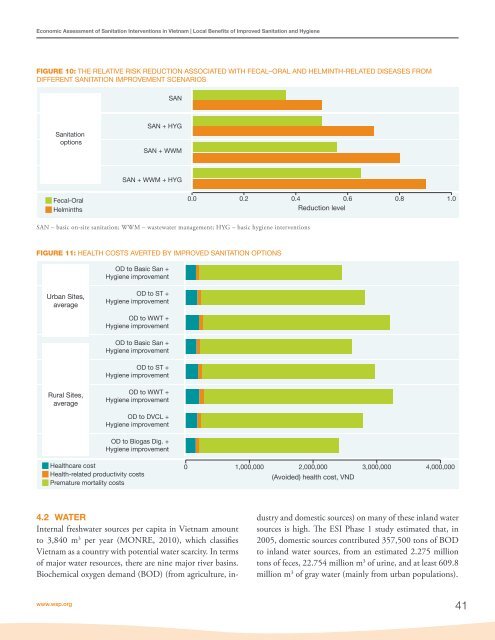
<strong>Economic</strong> <strong>Assessment</strong> <strong>of</strong> <strong>Sanitation</strong> <strong>Interventions</strong> <strong>in</strong> <strong>Vietnam</strong> | Local Benefits <strong>of</strong> Improved <strong>Sanitation</strong> and HygieneTABLE 25: ESTIMATED NUMBER OF ANNUAL DEATHS FROM POOR SANITATION AND HYGIENE, VIETNAMAge group<strong>in</strong>gDiseaseUnder 5 Over 5TotalDiarrheal diseases 4,136 440 4,576ALRI 1,475 - 1,475Measles 335 - 335Malaria 631 - 631Source: Environmental Health and Child Survival. World Bank, 2007.TABLE 26: UNIT VALUES FOR THE COST OF A PREMATURE DEATH, VIETNAMDiseaseWill<strong>in</strong>gness to pay us<strong>in</strong>g benefit transferVSL Income elasticity 1.0 at OER,transferr<strong>in</strong>g value <strong>of</strong> US$2 million from OECDcountriesHuman capital approachValues (VND, 2009)Low Mid (base case) HighVND287,604,600 VND575,226,600 VND1,150,453,2000-4 years VND311,233,800 VND443,073,600 VND944,698,2005-14 years VND383,670,000 VND522,974,400 VND1,041,703,20015+ years VND246,175,200 VND277,721,400 VND357,465,600Source: ESI-1, 2009.TABLE 27: AVERAGE PREMATURE MORTALITY COST PER PERSON PER YEAR, BY DISEASE AND AGE (VND, 2009)Disease 0-4 Years 5-14 Years 15+ YearsDiarrheal disease 415,512 10,266 5,220Indirect: malaria 44,892 - -Indirect: ALRI 112,230Total 572,634 10,266 5,220Source: ESI-1, 2009.40Figure 11 shows the costs averted due to sanitation andhygiene improvement <strong>in</strong> urban and rural areas as calculatedaverage values from all surveyed sites. The highestreduction <strong>in</strong> risk results from mov<strong>in</strong>g from unimprovedsanitation (OD) to wastewater treatment and hygieneimprovement. Similar results have been found <strong>in</strong> bothrural and urban areas. Double-vault compost<strong>in</strong>g, ur<strong>in</strong>edivert<strong>in</strong>g toilets (DVCL) and biogas digesters can reducehealth risk significantly, but the value <strong>of</strong> averted costsis less. Those options are associated with some limitationssuch as a lack <strong>of</strong> gray water treatment and the potentialrisks <strong>of</strong> <strong>in</strong>complete compost product reuse (fromDVCL), and <strong>in</strong>complete treatment <strong>of</strong> effluent from biogasdigesters.Annex Table B7 summarizes the total costs <strong>of</strong> poor sanitationand hygiene <strong>in</strong> <strong>Vietnam</strong>, per household for the selectedurban field sites, and the costs averted. The results from therural field sites are presented <strong>in</strong> Annex Table B8. Healthcosts associated with unimproved sanitation have a highervalue <strong>in</strong> rural areas (VND4,862,000 or US$278.0 versusVND3,977,000 or US$227.4 <strong>in</strong> urban areas). In urban areas,the highest average costs are averted by mov<strong>in</strong>g fromunimproved sanitation to centralized wastewater management,comb<strong>in</strong>ed with hygiene improvement <strong>in</strong>terventions(VND3,206,000, or US$183.3). In rural areas, the highestaverage costs are averted by mov<strong>in</strong>g from unimproved sanitationto cluster wastewater management, comb<strong>in</strong>ed withhygiene improvement <strong>in</strong>terventions (VND3,251,000 orUS$185.9).<strong>Economic</strong> <strong>Assessment</strong> <strong>of</strong> <strong>Sanitation</strong> <strong>Interventions</strong>
<strong>Economic</strong> <strong>Assessment</strong> <strong>of</strong> <strong>Sanitation</strong> <strong>Interventions</strong> <strong>in</strong> <strong>Vietnam</strong> | Local Benefits <strong>of</strong> Improved <strong>Sanitation</strong> and HygieneFIGURE 10: THE RELATIVE RISK REDUCTION ASSOCIATED WITH FECAL–ORAL AND HELMINTH-RELATED DISEASES FROMDIFFERENT SANITATION IMPROVEMENT SCENARIOSSAN<strong>Sanitation</strong>optionsSAN + HYGSAN + WWMSAN + WWM + HYGFecal-OralHelm<strong>in</strong>ths0.0 0.2 0.4 0.6 0.8 1.0Reduction levelSAN – basic on-site sanitation; WWM – wastewater management; HYG – basic hygiene <strong>in</strong>terventionsFIGURE 11: HEALTH COSTS AVERTED BY IMPROVED SANITATION OPTIONSOD to Basic San +Hygiene improvementUrban Sites,averageOD to ST +Hygiene improvementOD to WWT +Hygiene improvementOD to Basic San +Hygiene improvementOD to ST +Hygiene improvementRural Sites,averageOD to WWT +Hygiene improvementOD to DVCL +Hygiene improvementOD to Biogas Dig. +Hygiene improvementHealthcare costHealth-related productivity costsPremature mortality costs0 1,000,000 2,000,000 3,000,000 4,000,000(Avoided) health cost, VND4.2 WATERInternal freshwater sources per capita <strong>in</strong> <strong>Vietnam</strong> amountto 3,840 m 3 per year (MONRE, 2010), which classifies<strong>Vietnam</strong> as a country with potential water scarcity. In terms<strong>of</strong> major water resources, there are n<strong>in</strong>e major river bas<strong>in</strong>s.Biochemical oxygen demand (BOD) (from agriculture, <strong>in</strong>dustryand domestic sources) on many <strong>of</strong> these <strong>in</strong>land watersources is high. The ESI Phase 1 study estimated that, <strong>in</strong>2005, domestic sources contributed 357,500 tons <strong>of</strong> BODto <strong>in</strong>land water sources, from an estimated 2.275 milliontons <strong>of</strong> feces, 22.754 million m 3 <strong>of</strong> ur<strong>in</strong>e, and at least 609.8million m 3 <strong>of</strong> gray water (ma<strong>in</strong>ly from urban populations).www.wsp.org41