Economic Assessment of Sanitation Interventions in Vietnam - WSP
Economic Assessment of Sanitation Interventions in Vietnam - WSP
Economic Assessment of Sanitation Interventions in Vietnam - WSP

Create successful ePaper yourself
Turn your PDF publications into a flip-book with our unique Google optimized e-Paper software.
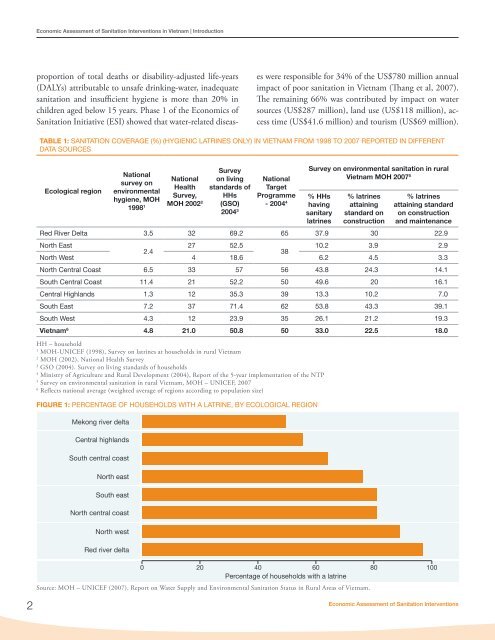
<strong>Economic</strong> <strong>Assessment</strong> <strong>of</strong> <strong>Sanitation</strong> <strong>Interventions</strong> <strong>in</strong> <strong>Vietnam</strong> | Introductionproportion <strong>of</strong> total deaths or disability-adjusted life-years(DALYs) attributable to unsafe dr<strong>in</strong>k<strong>in</strong>g-water, <strong>in</strong>adequatesanitation and <strong>in</strong>sufficient hygiene is more than 20% <strong>in</strong>children aged below 15 years. Phase 1 <strong>of</strong> the <strong>Economic</strong>s <strong>of</strong><strong>Sanitation</strong> Initiative (ESI) showed that water-related diseaseswere responsible for 34% <strong>of</strong> the US$780 million annualimpact <strong>of</strong> poor sanitation <strong>in</strong> <strong>Vietnam</strong> (Thang et al, 2007).The rema<strong>in</strong><strong>in</strong>g 66% was contributed by impact on watersources (US$287 million), land use (US$118 million), accesstime (US$41.6 million) and tourism (US$69 million).TABLE 1: SANITATION COVERAGE (%) (HYGIENIC LATRINES ONLY) IN VIETNAM FROM 1998 TO 2007 REPORTED IN DIFFERENTDATA SOURCESEcological regionNationalNationalsurvey onHealthenvironmentalSurvey,hygiene, MOHMOH 20021998 21Surveyon liv<strong>in</strong>g Nationalstandards <strong>of</strong> TargetHHs Programme(GSO)2004 3- 2004 4 hav<strong>in</strong>g atta<strong>in</strong><strong>in</strong>g atta<strong>in</strong><strong>in</strong>g standardSurvey on environmental sanitation <strong>in</strong> rural<strong>Vietnam</strong> MOH 2007 5% HHs % latr<strong>in</strong>es % latr<strong>in</strong>essanitarylatr<strong>in</strong>esstandard onconstructionon constructionand ma<strong>in</strong>tenanceRed River Delta 3.5 32 69.2 65 37.9 30 22.9North East27 52.510.2 3.9 2.92.438North West 4 18.6 6.2 4.5 3.3North Central Coast 6.5 33 57 56 43.8 24.3 14.1South Central Coast 11.4 21 52.2 50 49.6 20 16.1Central Highlands 1.3 12 35.3 39 13.3 10.2 7.0South East 7.2 37 71.4 62 53.8 43.3 39.1South West 4.3 12 23.9 35 26.1 21.2 19.3<strong>Vietnam</strong> 6 4.8 21.0 50.8 50 33.0 22.5 18.0HH – household1MOH-UNICEF (1998), Survey on latr<strong>in</strong>es at households <strong>in</strong> rural <strong>Vietnam</strong>2MOH (2002), National Health Survey3GSO (2004). Survey on liv<strong>in</strong>g standards <strong>of</strong> households4M<strong>in</strong>istry <strong>of</strong> Agriculture and Rural Development (2004), Report <strong>of</strong> the 5-year implementation <strong>of</strong> the NTP5Survey on environmental sanitation <strong>in</strong> rural <strong>Vietnam</strong>, MOH – UNICEF, 20076Reflects national average (weighted average <strong>of</strong> regions accord<strong>in</strong>g to population size)FIGURE 1: PERCENTAGE OF HOUSEHOLDS WITH A LATRINE, BY ECOLOGICAL REGIONMekong river deltaCentral highlandsSouth central coastNorth eastSouth eastNorth central coastNorth westRed river delta0 20 40 60 80 100Percentage <strong>of</strong> households with a latr<strong>in</strong>eSource: MOH – UNICEF (2007). Report on Water Supply and Environmental <strong>Sanitation</strong> Status <strong>in</strong> Rural Areas <strong>of</strong> <strong>Vietnam</strong>.2<strong>Economic</strong> <strong>Assessment</strong> <strong>of</strong> <strong>Sanitation</strong> <strong>Interventions</strong>