Economic Assessment of Sanitation Interventions in Vietnam - WSP
Economic Assessment of Sanitation Interventions in Vietnam - WSP
Economic Assessment of Sanitation Interventions in Vietnam - WSP

You also want an ePaper? Increase the reach of your titles
YUMPU automatically turns print PDFs into web optimized ePapers that Google loves.
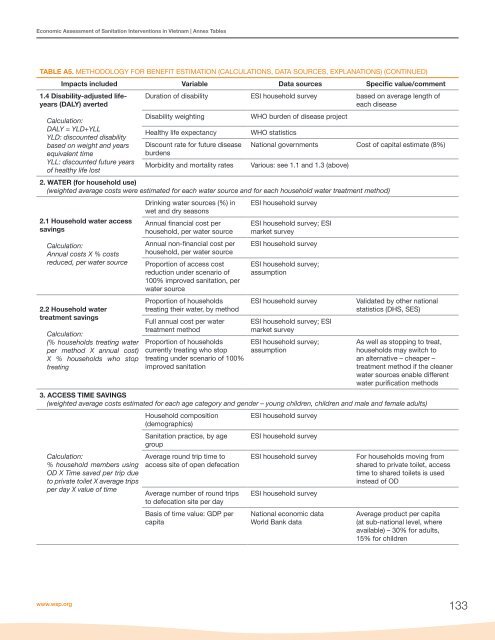
<strong>Economic</strong> <strong>Assessment</strong> <strong>of</strong> <strong>Sanitation</strong> <strong>Interventions</strong> <strong>in</strong> <strong>Vietnam</strong> | Annex TablesTABLE A5. METHODOLOGY FOR BENEFIT ESTIMATION (CALCULATIONS, DATA SOURCES, EXPLANATIONS) (CONTINUED)Impacts <strong>in</strong>cluded Variable Data sources Specific value/comment1.4 Disability-adjusted lifeyears(DALY) avertedCalculation:DALY = YLD+YLLYLD: discounted disabilitybased on weight and yearsequivalent timeYLL: discounted future years<strong>of</strong> healthy life lostDuration <strong>of</strong> disability ESI household survey based on average length <strong>of</strong>each diseaseDisability weight<strong>in</strong>gHealthy life expectancyDiscount rate for future diseaseburdensMorbidity and mortality ratesWHO burden <strong>of</strong> disease projectWHO statisticsNational governments Cost <strong>of</strong> capital estimate (8%)Various: see 1.1 and 1.3 (above)2. WATER (for household use)(weighted average costs were estimated for each water source and for each household water treatment method)2.1 Household water accesssav<strong>in</strong>gsCalculation:Annual costs X % costsreduced, per water source2.2 Household watertreatment sav<strong>in</strong>gsCalculation:(% households treat<strong>in</strong>g waterper method X annual cost)X % households who stoptreat<strong>in</strong>gDr<strong>in</strong>k<strong>in</strong>g water sources (%) <strong>in</strong>wet and dry seasonsAnnual f<strong>in</strong>ancial cost perhousehold, per water sourceAnnual non-f<strong>in</strong>ancial cost perhousehold, per water sourceProportion <strong>of</strong> access costreduction under scenario <strong>of</strong>100% improved sanitation, perwater sourceProportion <strong>of</strong> householdstreat<strong>in</strong>g their water, by methodFull annual cost per watertreatment methodProportion <strong>of</strong> householdscurrently treat<strong>in</strong>g who stoptreat<strong>in</strong>g under scenario <strong>of</strong> 100%improved sanitationESI household surveyESI household survey; ESImarket surveyESI household surveyESI household survey;assumptionESI household surveyESI household survey; ESImarket surveyESI household survey;assumptionValidated by other nationalstatistics (DHS, SES)As well as stopp<strong>in</strong>g to treat,households may switch toan alternative – cheaper –treatment method if the cleanerwater sources enable differentwater purification methods3. ACCESS TIME SAVINGS(weighted average costs estimated for each age category and gender – young children, children and male and female adults)Calculation:% household members us<strong>in</strong>gOD X Time saved per trip dueto private toilet X average tripsper day X value <strong>of</strong> timeHousehold composition(demographics)<strong>Sanitation</strong> practice, by agegroupAverage round trip time toaccess site <strong>of</strong> open defecationAverage number <strong>of</strong> round tripsto defecation site per dayBasis <strong>of</strong> time value: GDP percapitaESI household surveyESI household surveyESI household surveyESI household surveyNational economic dataWorld Bank dataFor households mov<strong>in</strong>g fromshared to private toilet, accesstime to shared toilets is used<strong>in</strong>stead <strong>of</strong> ODAverage product per capita(at sub-national level, whereavailable) – 30% for adults,15% for childrenwww.wsp.org133