Economic Assessment of Sanitation Interventions in Vietnam - WSP
Economic Assessment of Sanitation Interventions in Vietnam - WSP
Economic Assessment of Sanitation Interventions in Vietnam - WSP

Create successful ePaper yourself
Turn your PDF publications into a flip-book with our unique Google optimized e-Paper software.
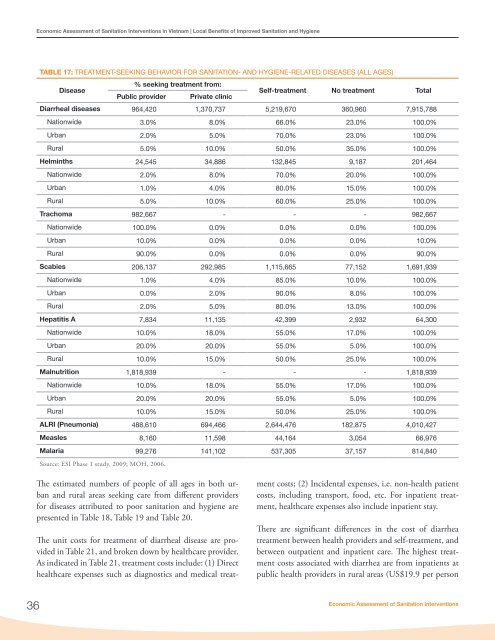
<strong>Economic</strong> <strong>Assessment</strong> <strong>of</strong> <strong>Sanitation</strong> <strong>Interventions</strong> <strong>in</strong> <strong>Vietnam</strong> | Local Benefits <strong>of</strong> Improved <strong>Sanitation</strong> and HygieneTABLE 17: TREATMENT-SEEKING BEHAVIOR FOR SANITATION- AND HYGIENE-RELATED DISEASES (ALL AGES)% seek<strong>in</strong>g treatment from:DiseasePublic provider Private cl<strong>in</strong>icSelf-treatment No treatment TotalDiarrheal diseases 964,420 1,370,737 5,219,670 360,960 7,915,788Nationwide 3.0% 8.0% 66.0% 23.0% 100.0%Urban 2.0% 5.0% 70.0% 23.0% 100.0%Rural 5.0% 10.0% 50.0% 35.0% 100.0%Helm<strong>in</strong>ths 24,545 34,886 132,845 9,187 201,464Nationwide 2.0% 8.0% 70.0% 20.0% 100.0%Urban 1.0% 4.0% 80.0% 15.0% 100.0%Rural 5.0% 10.0% 60.0% 25.0% 100.0%Trachoma 982,667 - - - 982,667Nationwide 100.0% 0.0% 0.0% 0.0% 100.0%Urban 10.0% 0.0% 0.0% 0.0% 10.0%Rural 90.0% 0.0% 0.0% 0.0% 90.0%Scabies 206,137 292,985 1,115,665 77,152 1,691,939Nationwide 1.0% 4.0% 85.0% 10.0% 100.0%Urban 0.0% 2.0% 90.0% 8.0% 100.0%Rural 2.0% 5.0% 80.0% 13.0% 100.0%Hepatitis A 7,834 11,135 42,399 2,932 64,300Nationwide 10.0% 18.0% 55.0% 17.0% 100.0%Urban 20.0% 20.0% 55.0% 5.0% 100.0%Rural 10.0% 15.0% 50.0% 25.0% 100.0%Malnutrition 1,818,939 - - - 1,818,939Nationwide 10.0% 18.0% 55.0% 17.0% 100.0%Urban 20.0% 20.0% 55.0% 5.0% 100.0%Rural 10.0% 15.0% 50.0% 25.0% 100.0%ALRI (Pneumonia) 488,610 694,466 2,644,476 182,875 4,010,427Measles 8,160 11,598 44,164 3,054 66,976Malaria 99,276 141,102 537,305 37,157 814,840Source: ESI Phase 1 study, 2009; MOH, 2006.The estimated numbers <strong>of</strong> people <strong>of</strong> all ages <strong>in</strong> both urbanand rural areas seek<strong>in</strong>g care from different providersfor diseases attributed to poor sanitation and hygiene arepresented <strong>in</strong> Table 18, Table 19 and Table 20.The unit costs for treatment <strong>of</strong> diarrheal disease are provided<strong>in</strong> Table 21, and broken down by healthcare provider.As <strong>in</strong>dicated <strong>in</strong> Table 21, treatment costs <strong>in</strong>clude: (1) Directhealthcare expenses such as diagnostics and medical treatmentcosts; (2) Incidental expenses, i.e. non-health patientcosts, <strong>in</strong>clud<strong>in</strong>g transport, food, etc. For <strong>in</strong>patient treatment,healthcare expenses also <strong>in</strong>clude <strong>in</strong>patient stay.There are significant differences <strong>in</strong> the cost <strong>of</strong> diarrheatreatment between health providers and self-treatment, andbetween outpatient and <strong>in</strong>patient care. The highest treatmentcosts associated with diarrhea are from <strong>in</strong>patients atpublic health providers <strong>in</strong> rural areas (US$19.9 per person36<strong>Economic</strong> <strong>Assessment</strong> <strong>of</strong> <strong>Sanitation</strong> <strong>Interventions</strong>