Economic Assessment of Sanitation Interventions in Vietnam - WSP
Economic Assessment of Sanitation Interventions in Vietnam - WSP
Economic Assessment of Sanitation Interventions in Vietnam - WSP

You also want an ePaper? Increase the reach of your titles
YUMPU automatically turns print PDFs into web optimized ePapers that Google loves.
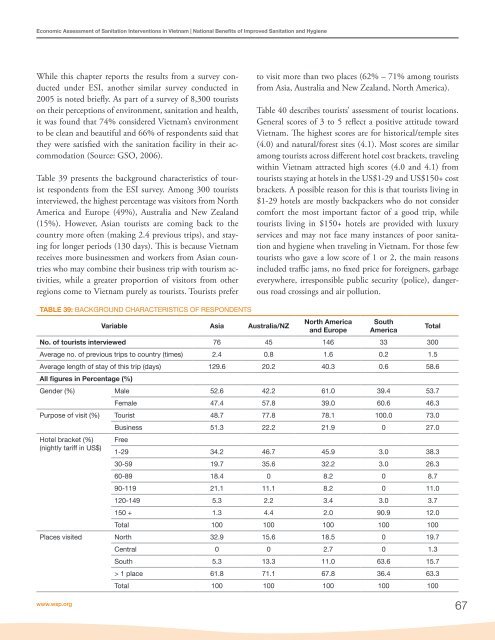
<strong>Economic</strong> <strong>Assessment</strong> <strong>of</strong> <strong>Sanitation</strong> <strong>Interventions</strong> <strong>in</strong> <strong>Vietnam</strong> | National Benefits <strong>of</strong> Improved <strong>Sanitation</strong> and HygieneWhile this chapter reports the results from a survey conductedunder ESI, another similar survey conducted <strong>in</strong>2005 is noted briefly. As part <strong>of</strong> a survey <strong>of</strong> 8,300 touristson their perceptions <strong>of</strong> environment, sanitation and health,it was found that 74% considered <strong>Vietnam</strong>’s environmentto be clean and beautiful and 66% <strong>of</strong> respondents said thatthey were satisfied with the sanitation facility <strong>in</strong> their accommodation(Source: GSO, 2006).Table 39 presents the background characteristics <strong>of</strong> touristrespondents from the ESI survey. Among 300 tourists<strong>in</strong>terviewed, the highest percentage was visitors from NorthAmerica and Europe (49%), Australia and New Zealand(15%). However, Asian tourists are com<strong>in</strong>g back to thecountry more <strong>of</strong>ten (mak<strong>in</strong>g 2.4 previous trips), and stay<strong>in</strong>gfor longer periods (130 days). This is because <strong>Vietnam</strong>receives more bus<strong>in</strong>essmen and workers from Asian countrieswho may comb<strong>in</strong>e their bus<strong>in</strong>ess trip with tourism activities,while a greater proportion <strong>of</strong> visitors from otherregions come to <strong>Vietnam</strong> purely as tourists. Tourists preferto visit more than two places (62% – 71% among touristsfrom Asia, Australia and New Zealand, North America).Table 40 describes tourists’ assessment <strong>of</strong> tourist locations.General scores <strong>of</strong> 3 to 5 reflect a positive attitude toward<strong>Vietnam</strong>. The highest scores are for historical/temple sites(4.0) and natural/forest sites (4.1). Most scores are similaramong tourists across different hotel cost brackets, travel<strong>in</strong>gwith<strong>in</strong> <strong>Vietnam</strong> attracted high scores (4.0 and 4.1) fromtourists stay<strong>in</strong>g at hotels <strong>in</strong> the US$1-29 and US$150+ costbrackets. A possible reason for this is that tourists liv<strong>in</strong>g <strong>in</strong>$1-29 hotels are mostly backpackers who do not considercomfort the most important factor <strong>of</strong> a good trip, whiletourists liv<strong>in</strong>g <strong>in</strong> $150+ hotels are provided with luxuryservices and may not face many <strong>in</strong>stances <strong>of</strong> poor sanitationand hygiene when travel<strong>in</strong>g <strong>in</strong> <strong>Vietnam</strong>. For those fewtourists who gave a low score <strong>of</strong> 1 or 2, the ma<strong>in</strong> reasons<strong>in</strong>cluded traffic jams, no fixed price for foreigners, garbageeverywhere, irresponsible public security (police), dangerousroad cross<strong>in</strong>gs and air pollution.TABLE 39: BACKGROUND CHARACTERISTICS OF RESPONDENTSVariable Asia Australia/NZNorth Americaand EuropeSouthAmericaNo. <strong>of</strong> tourists <strong>in</strong>terviewed 76 45 146 33 300Average no. <strong>of</strong> previous trips to country (times) 2.4 0.8 1.6 0.2 1.5Average length <strong>of</strong> stay <strong>of</strong> this trip (days) 129.6 20.2 40.3 0.6 58.6All figures <strong>in</strong> Percentage (%)Gender (%) Male 52.6 42.2 61.0 39.4 53.7Female 47.4 57.8 39.0 60.6 46.3Purpose <strong>of</strong> visit (%) Tourist 48.7 77.8 78.1 100.0 73.0Bus<strong>in</strong>ess 51.3 22.2 21.9 0 27.0Hotel bracket (%)(nightly tariff <strong>in</strong> US$)Free1-29 34.2 46.7 45.9 3.0 38.330-59 19.7 35.6 32.2 3.0 26.360-89 18.4 0 8.2 0 8.790-119 21.1 11.1 8.2 0 11.0120-149 5.3 2.2 3.4 3.0 3.7150 + 1.3 4.4 2.0 90.9 12.0Total 100 100 100 100 100Places visited North 32.9 15.6 18.5 0 19.7Central 0 0 2.7 0 1.3South 5.3 13.3 11.0 63.6 15.7> 1 place 61.8 71.1 67.8 36.4 63.3Total 100 100 100 100 100www.wsp.org67Total