Economic Assessment of Sanitation Interventions in Vietnam - WSP
Economic Assessment of Sanitation Interventions in Vietnam - WSP
Economic Assessment of Sanitation Interventions in Vietnam - WSP

Create successful ePaper yourself
Turn your PDF publications into a flip-book with our unique Google optimized e-Paper software.
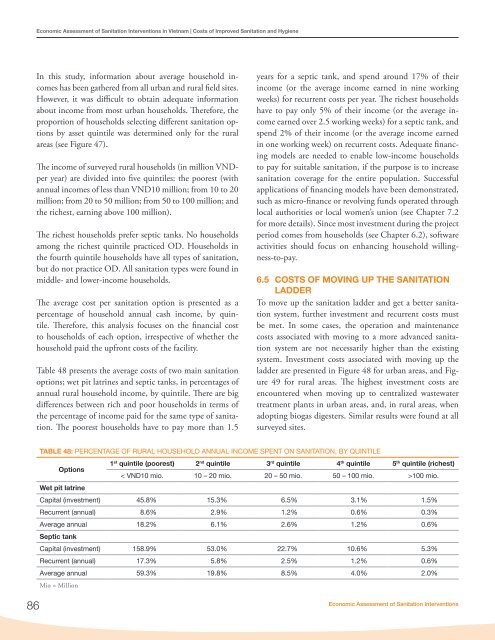
<strong>Economic</strong> <strong>Assessment</strong> <strong>of</strong> <strong>Sanitation</strong> <strong>Interventions</strong> <strong>in</strong> <strong>Vietnam</strong> | Costs <strong>of</strong> Improved <strong>Sanitation</strong> and HygieneIn this study, <strong>in</strong>formation about average household <strong>in</strong>comeshas been gathered from all urban and rural field sites.However, it was difficult to obta<strong>in</strong> adequate <strong>in</strong>formationabout <strong>in</strong>come from most urban households. Therefore, theproportion <strong>of</strong> households select<strong>in</strong>g different sanitation optionsby asset qu<strong>in</strong>tile was determ<strong>in</strong>ed only for the ruralareas (see Figure 47).The <strong>in</strong>come <strong>of</strong> surveyed rural households (<strong>in</strong> million VNDperyear) are divided <strong>in</strong>to five qu<strong>in</strong>tiles: the poorest (withannual <strong>in</strong>comes <strong>of</strong> less than VND10 million; from 10 to 20million; from 20 to 50 million; from 50 to 100 million; andthe richest, earn<strong>in</strong>g above 100 million).The richest households prefer septic tanks. No householdsamong the richest qu<strong>in</strong>tile practiced OD. Households <strong>in</strong>the fourth qu<strong>in</strong>tile households have all types <strong>of</strong> sanitation,but do not practice OD. All sanitation types were found <strong>in</strong>middle- and lower-<strong>in</strong>come households.The average cost per sanitation option is presented as apercentage <strong>of</strong> household annual cash <strong>in</strong>come, by qu<strong>in</strong>tile.Therefore, this analysis focuses on the f<strong>in</strong>ancial costto households <strong>of</strong> each option, irrespective <strong>of</strong> whether thehousehold paid the upfront costs <strong>of</strong> the facility.Table 48 presents the average costs <strong>of</strong> two ma<strong>in</strong> sanitationoptions; wet pit latr<strong>in</strong>es and septic tanks, <strong>in</strong> percentages <strong>of</strong>annual rural household <strong>in</strong>come, by qu<strong>in</strong>tile. There are bigdifferences between rich and poor households <strong>in</strong> terms <strong>of</strong>the percentage <strong>of</strong> <strong>in</strong>come paid for the same type <strong>of</strong> sanitation.The poorest households have to pay more than 1.5years for a septic tank, and spend around 17% <strong>of</strong> their<strong>in</strong>come (or the average <strong>in</strong>come earned <strong>in</strong> n<strong>in</strong>e work<strong>in</strong>gweeks) for recurrent costs per year. The richest householdshave to pay only 5% <strong>of</strong> their <strong>in</strong>come (or the average <strong>in</strong>comeearned over 2.5 work<strong>in</strong>g weeks) for a septic tank, andspend 2% <strong>of</strong> their <strong>in</strong>come (or the average <strong>in</strong>come earned<strong>in</strong> one work<strong>in</strong>g week) on recurrent costs. Adequate f<strong>in</strong>anc<strong>in</strong>gmodels are needed to enable low-<strong>in</strong>come householdsto pay for suitable sanitation, if the purpose is to <strong>in</strong>creasesanitation coverage for the entire population. Successfulapplications <strong>of</strong> f<strong>in</strong>anc<strong>in</strong>g models have been demonstrated,such as micro-f<strong>in</strong>ance or revolv<strong>in</strong>g funds operated throughlocal authorities or local women’s union (see Chapter 7.2for more details). S<strong>in</strong>ce most <strong>in</strong>vestment dur<strong>in</strong>g the projectperiod comes from households (see Chapter 6.2), s<strong>of</strong>twareactivities should focus on enhanc<strong>in</strong>g household will<strong>in</strong>gness-to-pay.6.5 COSTS OF MOVING UP THE SANITATIONLADDERTo move up the sanitation ladder and get a better sanitationsystem, further <strong>in</strong>vestment and recurrent costs mustbe met. In some cases, the operation and ma<strong>in</strong>tenancecosts associated with mov<strong>in</strong>g to a more advanced sanitationsystem are not necessarily higher than the exist<strong>in</strong>gsystem. Investment costs associated with mov<strong>in</strong>g up theladder are presented <strong>in</strong> Figure 48 for urban areas, and Figure49 for rural areas. The highest <strong>in</strong>vestment costs areencountered when mov<strong>in</strong>g up to centralized wastewatertreatment plants <strong>in</strong> urban areas, and, <strong>in</strong> rural areas, whenadopt<strong>in</strong>g biogas digesters. Similar results were found at allsurveyed sites.TABLE 48: PERCENTAGE OF RURAL HOUSEHOLD ANNUAL INCOME SPENT ON SANITATION, BY QUINTILEOptions1 st qu<strong>in</strong>tile (poorest) 2 nd qu<strong>in</strong>tile 3 rd qu<strong>in</strong>tile 4 th qu<strong>in</strong>tile 5 th qu<strong>in</strong>tile (richest)< VND10 mio. 10 – 20 mio. 20 – 50 mio. 50 – 100 mio. >100 mio.Wet pit latr<strong>in</strong>eCapital (<strong>in</strong>vestment) 45.8% 15.3% 6.5% 3.1% 1.5%Recurrent (annual) 8.6% 2.9% 1.2% 0.6% 0.3%Average annual 18.2% 6.1% 2.6% 1.2% 0.6%Septic tankCapital (<strong>in</strong>vestment) 158.9% 53.0% 22.7% 10.6% 5.3%Recurrent (annual) 17.3% 5.8% 2.5% 1.2% 0.6%Average annual 59.3% 19.8% 8.5% 4.0% 2.0%Mio = Million86<strong>Economic</strong> <strong>Assessment</strong> <strong>of</strong> <strong>Sanitation</strong> <strong>Interventions</strong>