Economic Assessment of Sanitation Interventions in Vietnam - WSP
Economic Assessment of Sanitation Interventions in Vietnam - WSP
Economic Assessment of Sanitation Interventions in Vietnam - WSP
Create successful ePaper yourself
Turn your PDF publications into a flip-book with our unique Google optimized e-Paper software.
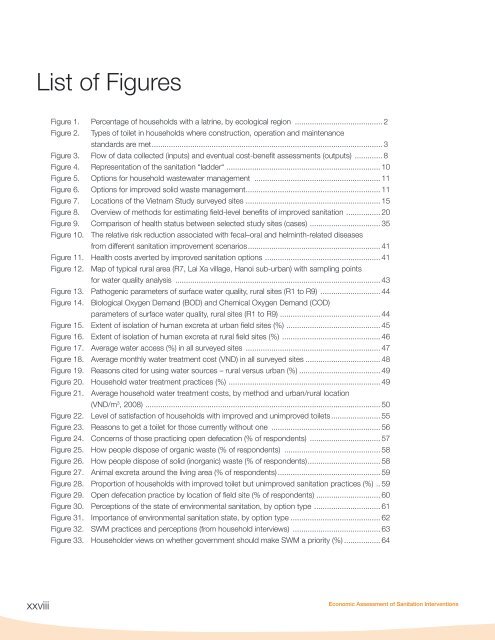
List <strong>of</strong> FiguresFigure 1. Percentage <strong>of</strong> households with a latr<strong>in</strong>e, by ecological region .......................................... 2Figure 2. Types <strong>of</strong> toilet <strong>in</strong> households where construction, operation and ma<strong>in</strong>tenancestandards are met............................................................................................................ 3Figure 3. Flow <strong>of</strong> data collected (<strong>in</strong>puts) and eventual cost-benefit assessments (outputs) .............. 8Figure 4. Representation <strong>of</strong> the sanitation “ladder“ ........................................................................ 10Figure 5. Options for household wastewater management ............................................................ 11Figure 6. Options for improved solid waste management............................................................... 11Figure 7. Locations <strong>of</strong> the <strong>Vietnam</strong> Study surveyed sites ............................................................... 15Figure 8. Overview <strong>of</strong> methods for estimat<strong>in</strong>g field-level benefits <strong>of</strong> improved sanitation ................ 20Figure 9. Comparison <strong>of</strong> health status between selected study sites (cases) ................................. 35Figure 10. The relative risk reduction associated with fecal–oral and helm<strong>in</strong>th-related diseasesfrom different sanitation improvement scenarios.............................................................. 41Figure 11. Health costs averted by improved sanitation options ...................................................... 41Figure 12. Map <strong>of</strong> typical rural area (R7, Lai Xa village, Hanoi sub-urban) with sampl<strong>in</strong>g po<strong>in</strong>tsfor water quality analysis ................................................................................................. 43Figure 13. Pathogenic parameters <strong>of</strong> surface water quality, rural sites (R1 to R9) ............................. 44Figure 14. Biological Oxygen Demand (BOD) and Chemical Oxygen Demand (COD)parameters <strong>of</strong> surface water quality, rural sites (R1 to R9) ............................................... 44Figure 15. Extent <strong>of</strong> isolation <strong>of</strong> human excreta at urban field sites (%) ............................................ 45Figure 16. Extent <strong>of</strong> isolation <strong>of</strong> human excreta at rural field sites (%) .............................................. 46Figure 17. Average water access (%) <strong>in</strong> all surveyed sites ................................................................ 47Figure 18. Average monthly water treatment cost (VND) <strong>in</strong> all surveyed sites.................................... 48Figure 19. Reasons cited for us<strong>in</strong>g water sources – rural versus urban (%)....................................... 49Figure 20. Household water treatment practices (%) ....................................................................... 49Figure 21. Average household water treatment costs, by method and urban/rural location(VND/m 3 , 2008) .............................................................................................................. 50Figure 22. Level <strong>of</strong> satisfaction <strong>of</strong> households with improved and unimproved toilets........................ 55Figure 23. Reasons to get a toilet for those currently without one .................................................... 56Figure 24. Concerns <strong>of</strong> those practic<strong>in</strong>g open defecation (% <strong>of</strong> respondents) .................................. 57Figure 25. How people dispose <strong>of</strong> organic waste (% <strong>of</strong> respondents) .............................................. 58Figure 26. How people dispose <strong>of</strong> solid (<strong>in</strong>organic) waste (% <strong>of</strong> respondents).................................. 58Figure 27. Animal excreta around the liv<strong>in</strong>g area (% <strong>of</strong> respondents)................................................. 59Figure 28. Proportion <strong>of</strong> households with improved toilet but unimproved sanitation practices (%) .. 59Figure 29. Open defecation practice by location <strong>of</strong> field site (% <strong>of</strong> respondents) .............................. 60Figure 30. Perceptions <strong>of</strong> the state <strong>of</strong> environmental sanitation, by option type ............................... 61Figure 31. Importance <strong>of</strong> environmental sanitation state, by option type........................................... 62Figure 32. SWM practices and perceptions (from household <strong>in</strong>terviews) .......................................... 63Figure 33. Householder views on whether government should make SWM a priority (%).................. 64xxviii<strong>Economic</strong> <strong>Assessment</strong> <strong>of</strong> <strong>Sanitation</strong> <strong>Interventions</strong>


