Economic Assessment of Sanitation Interventions in Vietnam - WSP
Economic Assessment of Sanitation Interventions in Vietnam - WSP
Economic Assessment of Sanitation Interventions in Vietnam - WSP

Create successful ePaper yourself
Turn your PDF publications into a flip-book with our unique Google optimized e-Paper software.
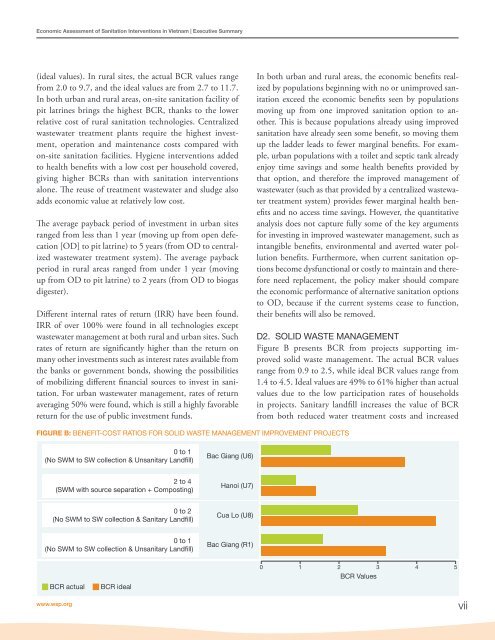
<strong>Economic</strong> <strong>Assessment</strong> <strong>of</strong> <strong>Sanitation</strong> <strong>Interventions</strong> <strong>in</strong> <strong>Vietnam</strong> | Executive Summary(ideal values). In rural sites, the actual BCR values rangefrom 2.0 to 9.7, and the ideal values are from 2.7 to 11.7.In both urban and rural areas, on-site sanitation facility <strong>of</strong>pit latr<strong>in</strong>es br<strong>in</strong>gs the highest BCR, thanks to the lowerrelative cost <strong>of</strong> rural sanitation technologies. Centralizedwastewater treatment plants require the highest <strong>in</strong>vestment,operation and ma<strong>in</strong>tenance costs compared withon-site sanitation facilities. Hygiene <strong>in</strong>terventions addedto health benefits with a low cost per household covered,giv<strong>in</strong>g higher BCRs than with sanitation <strong>in</strong>terventionsalone. The reuse <strong>of</strong> treatment wastewater and sludge alsoadds economic value at relatively low cost.The average payback period <strong>of</strong> <strong>in</strong>vestment <strong>in</strong> urban sitesranged from less than 1 year (mov<strong>in</strong>g up from open defecation[OD] to pit latr<strong>in</strong>e) to 5 years (from OD to centralizedwastewater treatment system). The average paybackperiod <strong>in</strong> rural areas ranged from under 1 year (mov<strong>in</strong>gup from OD to pit latr<strong>in</strong>e) to 2 years (from OD to biogasdigester).Different <strong>in</strong>ternal rates <strong>of</strong> return (IRR) have been found.IRR <strong>of</strong> over 100% were found <strong>in</strong> all technologies exceptwastewater management at both rural and urban sites. Suchrates <strong>of</strong> return are significantly higher than the return onmany other <strong>in</strong>vestments such as <strong>in</strong>terest rates available fromthe banks or government bonds, show<strong>in</strong>g the possibilities<strong>of</strong> mobiliz<strong>in</strong>g different f<strong>in</strong>ancial sources to <strong>in</strong>vest <strong>in</strong> sanitation.For urban wastewater management, rates <strong>of</strong> returnaverag<strong>in</strong>g 50% were found, which is still a highly favorablereturn for the use <strong>of</strong> public <strong>in</strong>vestment funds.In both urban and rural areas, the economic benefits realizedby populations beg<strong>in</strong>n<strong>in</strong>g with no or unimproved sanitationexceed the economic benefits seen by populationsmov<strong>in</strong>g up from one improved sanitation option to another.This is because populations already us<strong>in</strong>g improvedsanitation have already seen some benefit, so mov<strong>in</strong>g themup the ladder leads to fewer marg<strong>in</strong>al benefits. For example,urban populations with a toilet and septic tank alreadyenjoy time sav<strong>in</strong>gs and some health benefits provided bythat option, and therefore the improved management <strong>of</strong>wastewater (such as that provided by a centralized wastewatertreatment system) provides fewer marg<strong>in</strong>al health benefitsand no access time sav<strong>in</strong>gs. However, the quantitativeanalysis does not capture fully some <strong>of</strong> the key argumentsfor <strong>in</strong>vest<strong>in</strong>g <strong>in</strong> improved wastewater management, such as<strong>in</strong>tangible benefits, environmental and averted water pollutionbenefits. Furthermore, when current sanitation optionsbecome dysfunctional or costly to ma<strong>in</strong>ta<strong>in</strong> and thereforeneed replacement, the policy maker should comparethe economic performance <strong>of</strong> alternative sanitation optionsto OD, because if the current systems cease to function,their benefits will also be removed.D2. SOLID WASTE MANAGEMENTFigure B presents BCR from projects support<strong>in</strong>g improvedsolid waste management. The actual BCR valuesrange from 0.9 to 2.5, while ideal BCR values range from1.4 to 4.5. Ideal values are 49% to 61% higher than actualvalues due to the low participation rates <strong>of</strong> households<strong>in</strong> projects. Sanitary landfill <strong>in</strong>creases the value <strong>of</strong> BCRfrom both reduced water treatment costs and <strong>in</strong>creasedFIGURE B: BENEFIT-COST RATIOS FOR SOLID WASTE MANAGEMENT IMPROVEMENT PROJECTS0 to 1(No SWM to SW collection & Unsanitary Landfill)Bac Giang (U6)2 to 4(SWM with source separation + Compost<strong>in</strong>g)Hanoi (U7)0 to 2(No SWM to SW collection & Sanitary Landfill)Cua Lo (U8)0 to 1(No SWM to SW collection & Unsanitary Landfill)Bac Giang (R1)BCR actualBCR ideal0 1 2 3 4 5BCR Valueswww.wsp.orgvii