Economic Assessment of Sanitation Interventions in Vietnam - WSP
Economic Assessment of Sanitation Interventions in Vietnam - WSP
Economic Assessment of Sanitation Interventions in Vietnam - WSP

You also want an ePaper? Increase the reach of your titles
YUMPU automatically turns print PDFs into web optimized ePapers that Google loves.
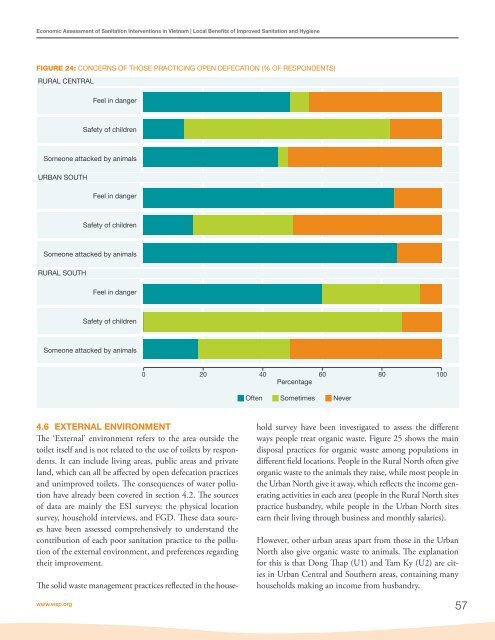
<strong>Economic</strong> <strong>Assessment</strong> <strong>of</strong> <strong>Sanitation</strong> <strong>Interventions</strong> <strong>in</strong> <strong>Vietnam</strong> | Local Benefits <strong>of</strong> Improved <strong>Sanitation</strong> and HygieneFIGURE 24: CONCERNS OF THOSE PRACTICING OPEN DEFECATION (% OF RESPONDENTS)RURAL CENTRALFeel <strong>in</strong> dangerSafety <strong>of</strong> childrenSomeone attacked by animalsURBAN SOUTHFeel <strong>in</strong> dangerSafety <strong>of</strong> childrenSomeone attacked by animalsRURAL SOUTHFeel <strong>in</strong> dangerSafety <strong>of</strong> childrenSomeone attacked by animals0 20 40 60 80 100PercentageOftenSometimesNever4.6 EXTERNAL ENVIRONMENTThe ‘External’ environment refers to the area outside thetoilet itself and is not related to the use <strong>of</strong> toilets by respondents.It can <strong>in</strong>clude liv<strong>in</strong>g areas, public areas and privateland, which can all be affected by open defecation practicesand unimproved toilets. The consequences <strong>of</strong> water pollutionhave already been covered <strong>in</strong> section 4.2. The sources<strong>of</strong> data are ma<strong>in</strong>ly the ESI surveys: the physical locationsurvey, household <strong>in</strong>terviews, and FGD. These data sourceshave been assessed comprehensively to understand thecontribution <strong>of</strong> each poor sanitation practice to the pollution<strong>of</strong> the external environment, and preferences regard<strong>in</strong>gtheir improvement.The solid waste management practices reflected <strong>in</strong> the householdsurvey have been <strong>in</strong>vestigated to assess the differentways people treat organic waste. Figure 25 shows the ma<strong>in</strong>disposal practices for organic waste among populations <strong>in</strong>different field locations. People <strong>in</strong> the Rural North <strong>of</strong>ten giveorganic waste to the animals they raise, while most people <strong>in</strong>the Urban North give it away, which reflects the <strong>in</strong>come generat<strong>in</strong>gactivities <strong>in</strong> each area (people <strong>in</strong> the Rural North sitespractice husbandry, while people <strong>in</strong> the Urban North sitesearn their liv<strong>in</strong>g through bus<strong>in</strong>ess and monthly salaries).However, other urban areas apart from those <strong>in</strong> the UrbanNorth also give organic waste to animals. The explanationfor this is that Dong Thap (U1) and Tam Ky (U2) are cities<strong>in</strong> Urban Central and Southern areas, conta<strong>in</strong><strong>in</strong>g manyhouseholds mak<strong>in</strong>g an <strong>in</strong>come from husbandry.www.wsp.org57