"Perspectives 2011" - Sustainability and Annual Report (pdf)
"Perspectives 2011" - Sustainability and Annual Report (pdf)
"Perspectives 2011" - Sustainability and Annual Report (pdf)

Create successful ePaper yourself
Turn your PDF publications into a flip-book with our unique Google optimized e-Paper software.
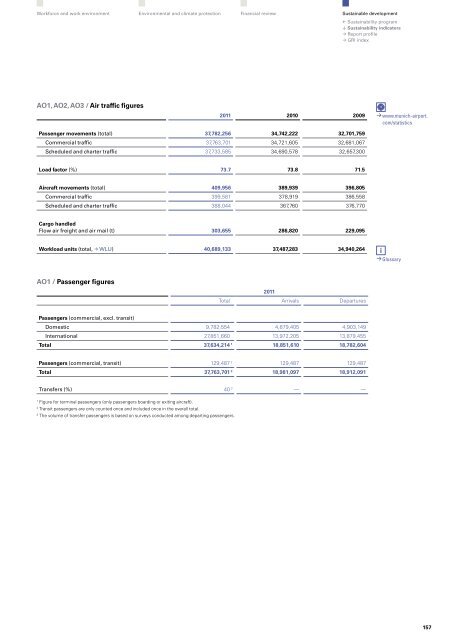
Workforce <strong>and</strong> work environmentEnvironmental <strong>and</strong> climate protectionFinancial reviewSustainable developmentP <strong>Sustainability</strong> programq <strong>Sustainability</strong> indicatorsp <strong>Report</strong> profilep GRI indexAO1, AO2, AO3 / Air traffic figures2011 2010 2009) www.munich-airport.com/statisticsPassenger movements (total) 37,782,256 34,742,222 32,701,759Commercial traffic 37,763,701 34,721,605 32,681,067Scheduled <strong>and</strong> charter traffic 37,733,585 34,690,578 32,657,300Load factor (%) 73.7 73.8 71.5Aircraft movements (total) 409,956 389,939 396,805Commercial traffic 399,581 378,919 386,558Scheduled <strong>and</strong> charter traffic 388,044 367,760 376,770Cargo h<strong>and</strong>ledFlow air freight <strong>and</strong> air mail (t) 303,655 286,820 229,095Workload units (total, ) WLU) 40,689,133 37,487,283 34,940,264) GlossaryAO1 / Passenger figures2011Total Arrivals DeparturesPassengers (commercial, excl. transit)Domestic 9,782,554 4,879,405 4,903,149International 27,851,660 13,972,205 13,879,455Total 37,634,214 1 18,851,610 18,782,604Passengers (commercial, transit) 129,487 2 129,487 129,487Total 37,763,701 2 18,981,097 18,912,091Transfers (%) 40 3 — —1Figure for terminal passengers (only passengers boarding or exiting aircraft).2Transit passengers are only counted once <strong>and</strong> included once in the overall total.3The volume of transfer passengers is based on surveys conducted among departing passengers.157