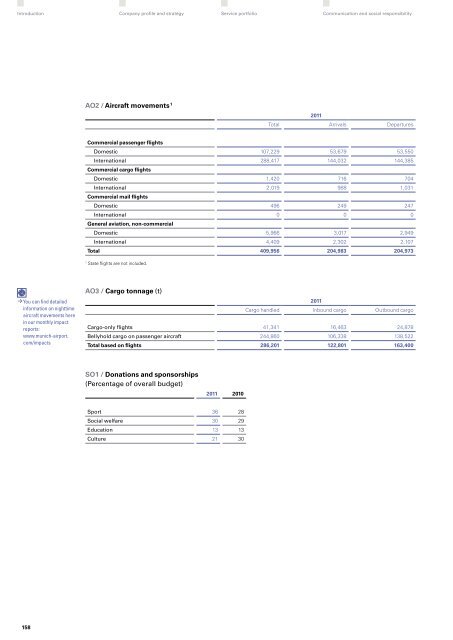
AO2 / Aircraft movements 1 2011Introduction Company profile <strong>and</strong> strategyService portfolio Communication <strong>and</strong> social responsibilityTotal Arrivals DeparturesCommercial passenger flightsDomestic 107,229 53,679 53,550International 288,417 144,032 144,385Commercial cargo flightsDomestic 1,420 716 704International 2,019 988 1,031Commercial mail flightsDomestic 496 249 247International 0 0 0General aviation, non-commercialDomestic 5,966 3,017 2,949International 4,409 2,302 2,107Total 409,956 204,983 204,9731State flights are not included.) You can find detailedinformation on nighttimeaircraft movements herein our monthly impactreports:www.munich-airport.com/impactsAO3 / Cargo tonnage (t)2011Cargo h<strong>and</strong>led Inbound cargo Outbound cargoCargo-only flights 41,341 16,463 24,878Bellyhold cargo on passenger aircraft 244,860 106,338 138,522Total based on flights 286,201 122,801 163,400SO1 / Donations <strong>and</strong> sponsorships(Percentage of overall budget)2011 2010Sport 36 28Social welfare 30 29Education 13 13Culture 21 30158
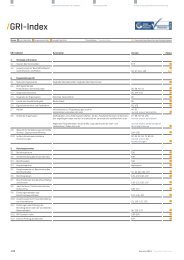
LA1, LA4, LA13 / Total workforce 1 2011 2010 2009Workforce <strong>and</strong> work environmentEnvironmental <strong>and</strong> climate protectionFinancial reviewSustainable developmentP <strong>Sustainability</strong> programq <strong>Sustainability</strong> indicatorsp <strong>Report</strong> profilep GRI indexThis year’s report is the first to include detailedwork force figures that distinguish between men <strong>and</strong>women working for Flughafen München GmbH <strong>and</strong>the FMG Group.Due to the merging of our former Ground H<strong>and</strong>lingdivision into the FMG subsidiary AeroGround <strong>and</strong> theresulting internal HR changes, we have chosen not toinclude year-on-year comparison figures (other thanfor the total workforce) in this year’s report as theywould not be representative. We will resume publishingannual comparison figures from 2012.The workforce figures for the Group include all majorityowned subsidiaries <strong>and</strong> FMG.FMG Group Women % Men % Total % Total TotalTotal workforce 2,314 33.71 4,550 66.29 6,864 100 6,862 7,100Full <strong>and</strong> part time employees 2Part time 819 11.93 521 7.59 1,340 19.52Full time 1,495 21.78 4,029 58.70 5,524 80.48Employment contracts 2Limited 456 6.64 402 5.86 858 12.50Permanent 1,858 27.07 4,148 60.43 6,006 87.50Other employeesTrainees 149 — 88 — 237 —Interns 18 — 17 — 35 —Temporary workers 20 — 541 — 561 —Workers in marginal employment 110 — 225 — 335 —Employees under collective bargainingcontracts 6,739Total employees on campus 3 29,560 29,560 29,5602011 2010 2009FMG Women % Men % Total % Total TotalTotal workforce 746 18.81 3,221 81.19 3,967 100 4,169 4,342Full <strong>and</strong> part time employees 2Part time 273 6.88 330 8.32 603 15.20Full time 473 11.92 2,891 72.88 3,364 84.80Employment contracts 2Limited 17 0.43 58 1.46 75 1.89Permanent 729 18.38 3,163 79.73 3,892 98.11Other employeesTrainees 81 — 54 — 135 —Interns 17 — 16 — 33 —Temporary workers 0 — 0 — 0 —Workers in marginal employment 4 — 39 — 43 —Employees under collective bargainingcontracts 3,8281At December 31, 20112Excl. trainees, workers in marginal employment, temporary workers <strong>and</strong> interns3Based on three-yearly workplace survey, last conducted in 2009159