"Perspectives 2011" - Sustainability and Annual Report (pdf)
"Perspectives 2011" - Sustainability and Annual Report (pdf)
"Perspectives 2011" - Sustainability and Annual Report (pdf)

You also want an ePaper? Increase the reach of your titles
YUMPU automatically turns print PDFs into web optimized ePapers that Google loves.
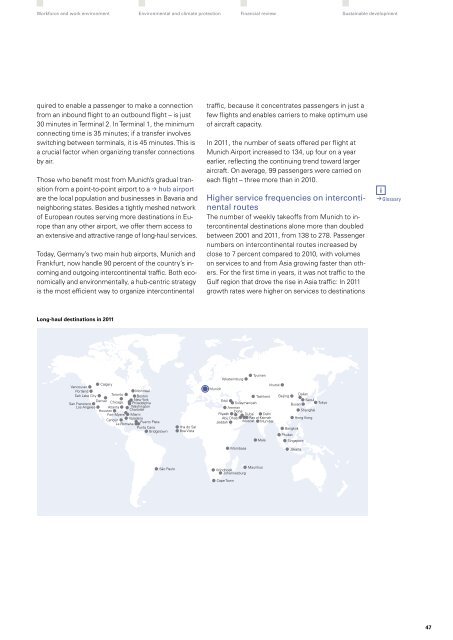
Workforce <strong>and</strong> work environmentEnvironmental <strong>and</strong> climate protectionFinancial reviewSustainable developmentquired to enable a passenger to make a connectionfrom an inbound flight to an outbound flight – is just30 minutes in Terminal 2. In Terminal 1, the minimumconnecting time is 35 minutes; if a transfer involvesswitching between terminals, it is 45 minutes. This isa crucial factor when organizing transfer connectionsby air.Those who benefit most from Munich’s gradual transitionfrom a point-to-point airport to a ) hub airportare the local population <strong>and</strong> businesses in Bavaria <strong>and</strong>neighboring states. Besides a tightly meshed networkof European routes serving more destinations in Europethan any other airport, we offer them access toan extensive <strong>and</strong> attractive range of long-haul services.Today, Germany’s two main hub airports, Munich <strong>and</strong>Frankfurt, now h<strong>and</strong>le 90 percent of the country’s in -coming <strong>and</strong> outgoing intercontinental traffic. Both economically<strong>and</strong> environmentally, a hub-centric strategyis the most efficient way to organize intercontinentaltraffic, because it concentrates passengers in just afew flights <strong>and</strong> enables carriers to make optimum useof aircraft capacity.In 2011, the number of seats offered per flight atMunich Airport increased to 134, up four on a yearearlier, reflecting the continuing trend toward largeraircraft. On average, 99 passengers were carried oneach flight – three more than in 2010.Higher service frequencies on intercontinentalroutesThe number of weekly takeoffs from Munich to intercontinentaldestinations alone more than doubledbetween 2001 <strong>and</strong> 2011, from 138 to 278. Passengernumbers on intercontinental routes increased byclose to 7 percent compared to 2010, with volumeson services to <strong>and</strong> from Asia growing faster than others.For the first time in years, it was not traffic to theGulf region that drove the rise in Asia traffic: In 2011growth rates were higher on services to destinations) GlossaryLong-haul destinations in 2011CalgaryVancouverPortl<strong>and</strong>Salt Lake City TorontoSan FranciscoLos AngelesDenver ChicagoAtlantaHoustonFort MyersCancúnMontrealBostonNew YorkPhiladelphiaWashingtonCharlotteMiamiVaraderoPuerto PlataLa RomanaPunta CanaBridgetownIlha do SalBoa VistaMunichYekaterinburgTyumenTashkentErbilSulaymaniyahAmmanDohaRiyadh Dubai DelhiAbu Dhabi Ras al-KaimahJeddah Muscat MumbaiMaleIrkutskDalianBeijingSeoulBusanTokyoShanghaiHong KongBangkokPhuketSingaporeMombasaJakartaSão PauloWindhoekJohannesburgCape TownMauritius47