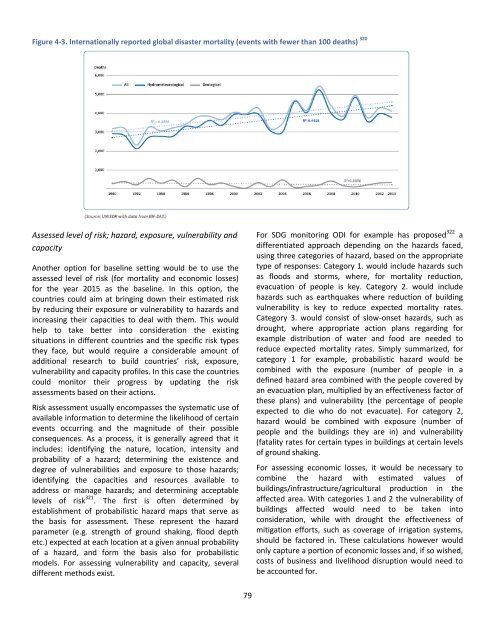
4.3.4. Baseline setting and assessing risk: strengthsand challengesRobust monitoring of the SDG targets will also require theuse of sound baselines, numbers used as a starting pointagainst which progress would be measured against. Thebaseline-setting methodology should be the same as themethod used to measure progress towards a target.As a very simplified categorization, three different optionsfor baseline setting could be envisaged, as put forward bythe scientific community. These include the use of averagelosses derived from observed historical data over a certainperiod of time; measuring progress using simplified hazard,exposure and vulnerability to measure levels of risk andcompare points in time; and measuring progress fromexpected losses from catastrophe models, to comparepoints in time. The two latter options compare theestimated risk at single points in time, such as 2015 to2030, and the baseline numbers of risk would be based onthe exposure and vulnerability in those particular years.The question of the method is also linked to the issue oftarget level setting, since enhanced data and use of riskassessments and probabilistic scenario models will directlycontribute to countries’ understanding of their risk profileand possible progress in the upcoming 15 years. Taking intoaccount current coverage of data sets and the state of riskassessments, the use of baselines based on observedhistorical losses might prove to be the most feasible optionfor the moment. However, risk assessments and modelsbased on scientific information also provide countriesimmensely useful tools in other spheres of DRR planningand are hence showcased here. A detailed assessmentcould be carried out for each of the options of thesuitability of methods and what can be achieved in acertain timeframe.Observed historical dataUsing observed disaster loss data as the baseline is thesimplest of the three options. However, it is important tomention that during the WCDRR discussions some notedthat even this would prove challenging at national level forsome countries due to the lack of loss data. In the SendaiFramework the Member States decided to use a 10-yearaverage as a measure for global targeted reduction ofmortality, and built this in the target: “Substantially reduceglobal disaster mortality by 2030, aiming to lower averageper 100,000 global mortality between 2020-2030 comparedto 2005-2015”. For economic losses a baseline was notspecified, as is the case with the SDG targets.Questions arise with respect to the 15-year timeframeproposed for the SDGs and whether the target will be onlyaddressed at the global level or also with countries settingappropriate national target levels. First, for naturaldisasters loss distributions are often dominated by theimpact of high-severity and low-frequency events (e.g.earthquakes, volcanic eruptions and earthquake-relatedtsunamis and landslides). This means that particularly atnational level there is unlikely to be a sufficient number ofevents occurring in a particular country to make statisticallysignificant comparisons between two 15-year periods ofobservation. While mortality might appear to be on therise, this trend might not be statistically significant and canchange depending on the time period chosen and theintensive disasters occurring in that period. One goodexample of this is Haiti, where from 1900 to 2009earthquakes killed fewer than 10 people, but then in the2010 earthquake an estimated 222,570 people werekilled 317 .Second, past experience shows that 15 years will allowcountries with some types of risk profiles, such as recurringfloods, to make significant progress in reducing mortality bybuilding effective defences and evacuation planning, whilefor others experiencing significant earthquakes, reducingthe existing risk exposure by re-building or retrofitting thebuilding stock, will prove much more challenging. Theseissues need to be taken into consideration when proposingappropriate target levels at national level.However, when assessing losses for smaller and localised,more frequent events, i.e. losses associated with extensivedisaster events, a significant upward trend can beobserved, both in national and in global loss data sets.There is a statistically significant trend towards increasingmortality in events with fewer than 100 deaths (Figure 4-3),and extensive disaster mortality is also increasing relativeto population size 318 . Hence, during the negotiations for theWCDRR, the UNISDR Secretariat proposed to monitor themortality target from national disaster databases using abaseline of 2005-2015 and adopting an appropriateprocedure to filter out low-frequency high-impact losses.For economic losses the Secretariat proposed combiningmodelled economic losses for smaller disasters fromnational disaster databases with assessed losses from largedisasters captured from international disaster databases 319 .78
Figure 4-3. Internationally reported global disaster mortality (events with fewer than 100 deaths) 320Assessed level of risk; hazard, exposure, vulnerability andcapacityAnother option for baseline setting would be to use theassessed level of risk (for mortality and economic losses)for the year 2015 as the baseline. In this option, thecountries could aim at bringing down their estimated riskby reducing their exposure or vulnerability to hazards andincreasing their capacities to deal with them. This wouldhelp to take better into consideration the existingsituations in different countries and the specific risk typesthey face, but would require a considerable amount ofadditional research to build countries’ risk, exposure,vulnerability and capacity profiles. In this case the countriescould monitor their progress by updating the riskassessments based on their actions.Risk assessment usually encompasses the systematic use ofavailable information to determine the likelihood of certainevents occurring and the magnitude of their possibleconsequences. As a process, it is generally agreed that itincludes: identifying the nature, location, intensity andprobability of a hazard; determining the existence anddegree of vulnerabilities and exposure to those hazards;identifying the capacities and resources available toaddress or manage hazards; and determining acceptablelevels of risk 321 . The first is often determined byestablishment of probabilistic hazard maps that serve asthe basis for assessment. These represent the hazardparameter (e.g. strength of ground shaking, flood depthetc.) expected at each location at a given annual probabilityof a hazard, and form the basis also for probabilisticmodels. For assessing vulnerability and capacity, severaldifferent methods exist.For SDG monitoring ODI for example has proposed 322 adifferentiated approach depending on the hazards faced,using three categories of hazard, based on the appropriatetype of responses: Category 1. would include hazards suchas floods and storms, where, for mortality reduction,evacuation of people is key. Category 2. would includehazards such as earthquakes where reduction of buildingvulnerability is key to reduce expected mortality rates.Category 3. would consist of slow-onset hazards, such asdrought, where appropriate action plans regarding forexample distribution of water and food are needed toreduce expected mortality rates. Simply summarized, forcategory 1 for example, probabilistic hazard would becombined with the exposure (number of people in adefined hazard area combined with the people covered byan evacuation plan, multiplied by an effectiveness factor ofthese plans) and vulnerability (the percentage of peopleexpected to die who do not evacuate). For category 2,hazard would be combined with exposure (number ofpeople and the buildings they are in) and vulnerability(fatality rates for certain types in buildings at certain levelsof ground shaking.For assessing economic losses, it would be necessary tocombine the hazard with estimated values ofbuildings/infrastructure/agricultural production in theaffected area. With categories 1 and 2 the vulnerability ofbuildings affected would need to be taken intoconsideration, while with drought the effectiveness ofmitigation efforts, such as coverage of irrigation systems,should be factored in. These calculations however wouldonly capture a portion of economic losses and, if so wished,costs of business and livelihood disruption would need tobe accounted for.79
- Page 1 and 2:
GLOBAL SUSTAINABLEDEVELOPMENT REPOR
- Page 3:
ForewordIn September 2015, world le
- Page 6 and 7:
3.1. Interlinked issues: oceans, se
- Page 8 and 9:
7.2.1. Open call for inputs to the
- Page 10 and 11:
Box 5-10. Operationalizing inclusiv
- Page 12 and 13:
Figure 8-8. Location of ambulance u
- Page 14 and 15:
Hentinnen (DFID); Annabelle Moatty
- Page 16 and 17:
Friendship University of Russia, Ru
- Page 18 and 19:
List of Abbreviations and AcronymsA
- Page 20 and 21:
IRENAIRIISEALISSCITCITU-TIUCNIUUIWM
- Page 22 and 23:
USAIDVPoAVSSWBGUWCDRRWEFWFPWMOWTOWW
- Page 24 and 25:
Figure ES-0-1. Possible roles for t
- Page 26 and 27:
Figure ES-0-2. Links among SDGs thr
- Page 28 and 29:
increase either the availability or
- Page 30 and 31:
Chapter 1.The Science Policy Interf
- Page 32 and 33: Complex relationship between scienc
- Page 34 and 35: Communication between scientists an
- Page 36 and 37: 1.2.1. Highlighting trends and prov
- Page 38 and 39: International, Marine Stewardship C
- Page 40 and 41: limited. There is a relative dearth
- Page 42 and 43: educe the time lag between science
- Page 44 and 45: Chapter 2. Integrated Perspectives
- Page 46 and 47: 2.1.4. Recommendations by the Inter
- Page 48 and 49: ultimate idea is systems design - t
- Page 50 and 51: 2.2. Integrated SDG perspectives in
- Page 52 and 53: Hunger andagriculturePovertyWorld B
- Page 54 and 55: IIASA-GEAPBLSEIOECDRITE-ALPSFEEMGSG
- Page 56 and 57: Table 2-4. Number of models capturi
- Page 58 and 59: In order for oceans, seas and marin
- Page 60 and 61: fully integrated scientific assessm
- Page 62 and 63: While some efforts are undertaken t
- Page 64 and 65: Table 3-3. Impact of important clas
- Page 66 and 67: Marine pollution from marine and la
- Page 68 and 69: While the scientific coverage of th
- Page 70 and 71: managementinitiative in BancoChinch
- Page 72 and 73: equired, with natural and social sc
- Page 74 and 75: Table 4-1. SDGs and DRR linkagesSDG
- Page 76 and 77: poverty forces low-income household
- Page 78 and 79: Figure 4-1. Economic losses relativ
- Page 80 and 81: OECD countries and, if they are ava
- Page 84: Using assessed levels of risk as ba
- Page 87 and 88: Table 4-3. Disaster management cycl
- Page 89 and 90: New sensor data also includes unman
- Page 91 and 92: Chapter 5. Economic Growth, Inclusi
- Page 93 and 94: Table 5-1. Industrial policy waves
- Page 95 and 96: Figure 5-3. Number of Y02 patents p
- Page 97 and 98: increasingly production specific an
- Page 99 and 100: 5.3. Industrialisation and social s
- Page 101 and 102: education will either make it hard
- Page 103 and 104: Table 5-3. UNEP’s five key types
- Page 105 and 106: 5.6. Concluding remarksThe precedin
- Page 107 and 108: occurs despite the lower share of e
- Page 109 and 110: LLDCs face several development chal
- Page 111 and 112: technology-innovation (STI) policie
- Page 113 and 114: 6.2.3. Relevant publications for LD
- Page 115 and 116: - A patent bank would help LDCs sec
- Page 117 and 118: In comparison to the Almaty Program
- Page 119 and 120: Box 6-6. ASYCUDA and Landlocked Cou
- Page 121 and 122: 6.4.5. The landscape of SIDS relate
- Page 123 and 124: Table 6-2. Example of science-polic
- Page 125 and 126: Figure 6-9. Data availability for i
- Page 127 and 128: Review Focusing on the Least Develo
- Page 129 and 130: Table 6-5. Coverage of SDGs in publ
- Page 131 and 132: - SYLWESTER, Kevin. Foreign direct
- Page 133 and 134:
SIDS:- UNCTAD. Improving transit tr
- Page 135 and 136:
Chapter 7.Science Issues for the At
- Page 137 and 138:
7.2.1. Open call for inputs to the
- Page 139 and 140:
implementation (SDG17), peaceful an
- Page 141 and 142:
percentage of women holding a leade
- Page 143 and 144:
environment, in order to make stron
- Page 145 and 146:
technology transfer. Respect for ea
- Page 147 and 148:
Figure 7-5. Concentrations of plast
- Page 149 and 150:
SDGs What is measured? Data source
- Page 151 and 152:
UN SystementityECLAC Drafted and re
- Page 153 and 154:
Figure 7-6 shows very wide ranges f
- Page 155 and 156:
Table 7-8. Factors that promoted or
- Page 157 and 158:
Chapter 8. New Data Approaches for
- Page 159 and 160:
These novel Internet- and SMS-based
- Page 161 and 162:
GabonNamibiaNigerSenegalRep CongoC
- Page 163 and 164:
Figure 8-5. Poverty map for Guinea,
- Page 165 and 166:
Figure 8-9. Map of internet connect
- Page 167 and 168:
Box 8-11. A geographical approach t
- Page 169 and 170:
There are many well established met
- Page 171 and 172:
epidemics. Some African countries a
- Page 173 and 174:
Figure 8-13. Data innovations cover
- Page 175 and 176:
issues” in respective areas of ex
- Page 177 and 178:
Notes1 United Nations, Prototype Gl
- Page 179 and 180:
51 Contributions sent by national l
- Page 181 and 182:
112 The 72 models are: AIM, ASF, AS
- Page 183 and 184:
201 For more information, please vi
- Page 185 and 186:
276 A. R. Subbiah, Lolita Bildan, a
- Page 187 and 188:
354 Information available at: http:
- Page 189 and 190:
African Economic Outlook, Structura
- Page 191 and 192:
512 Report Of The International Min
- Page 193 and 194:
595 Jessica N. Reimer et.al, Health
- Page 195 and 196:
671 Pulselabkampala.ug, 'UNFPA Ugan
- Page 197 and 198:
732 Climate Change timeline: (a) Sc
- Page 199 and 200:
790 Oxfam. ICT in humanitarian prac
- Page 201 and 202:
863 T. Dinku. New approaches to imp