- Page 1 and 2:
Acknowledgments Acknowledgments to
- Page 3 and 4:
knowing that he would understand an
- Page 5 and 6:
These sections tend to be graphical
- Page 7 and 8:
Go ahead and set this up now, so th
- Page 9 and 10:
First, Kyma asks you to invest some
- Page 11 and 12:
Grammar Kyma “sentences” are co
- Page 13 and 14: A Sound, no matter how complex, can
- Page 15 and 16: Whether you are composing or design
- Page 17 and 18: Data-driven Sound Patterns in exper
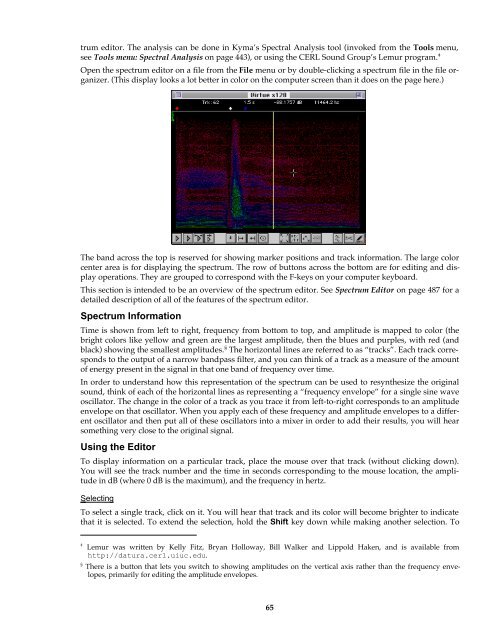
- Page 19 and 20: Preproduction The items in the Tool
- Page 21 and 22: ♦ The spectrum editor is a two-di
- Page 24 and 25: Sound, Sound File, and Sound Editor
- Page 26 and 27: Help and Information For on-line he
- Page 28 and 29: tem. However, you can drag a Sound
- Page 30 and 31: Delete To remove Sound A from the s
- Page 32 and 33: Whenever you want to make sure that
- Page 34 and 35: Parameters Suppose you wanted to dr
- Page 36 and 37: to replace the old value. § Then u
- Page 38 and 39: Event Values Even though the Generi
- Page 40 and 41: Status Whenever you play a Sound th
- Page 42 and 43: Kyma will make an association betwe
- Page 44 and 45: Scale and Offset 90% of all arithme
- Page 46 and 47: So if you see a parameter field tha
- Page 48 and 49: Automation To prevent a controller
- Page 50 and 51: To read several channels, create se
- Page 52 and 53: Smoothing Things Over To filter or
- Page 54 and 55: Now select and play the FormantBank
- Page 56 and 57: For example, to set controller numb
- Page 58 and 59: MIDI Controllers The output of any
- Page 60: Cross-mapping Parameters There is n
- Page 63: Sample Editor Getting Information o
- Page 67 and 68: Text Preferences There is not that
- Page 69 and 70: Select the folders in the top list
- Page 71 and 72: Algorithmic Splicing and Mixing Scr
- Page 73 and 74: Who’s on top? the value of a vari
- Page 75 and 76: TimeController is a little less ext
- Page 77 and 78: To play a compiled Sound, tab into
- Page 79 and 80: Compile, load You may notice that s
- Page 82 and 83: Strategies for Non-real-time In som
- Page 84 and 85: Remove Redundancy The most common s
- Page 86 and 87: Learning Kyma When people tell us t
- Page 88 and 89: You will get the most out of this
- Page 90 and 91: You can read these settings, but yo
- Page 92 and 93: lowing the tutorials step-by-step,
- Page 94 and 95: Audio Demonstrations These examples
- Page 96 and 97: Now examine the value of Frequencie
- Page 98 and 99: Backgrounds, Textures Sounds in thi
- Page 100 and 101: Edit cloud1, setting the parameters
- Page 102 and 103: In pick out unvoiced the EX version
- Page 104 and 105: Go back and double-click on synthet
- Page 106 and 107: FFT cross synth RE Analysis Tool Tr
- Page 108 and 109: Delays, Chorusing, Reverb Delays Ch
- Page 110 and 111: So you could model a sound source i
- Page 112 and 113: Disk Recording, Playback Playback R
- Page 114 and 115:
Multi-tracking this could be used t
- Page 116 and 117:
Distortion Waveshaping Clipping By
- Page 118 and 119:
down. At all other times, the ampli
- Page 120 and 121:
Envelopes In general usage, the wor
- Page 122 and 123:
Formants Picture a sine wave added
- Page 124 and 125:
Frequency Scaling One of the most c
- Page 126 and 127:
It looks very much like a series of
- Page 128 and 129:
RE Synthesis Surrealism Double-clic
- Page 130 and 131:
F13 frequencies, we have to multipl
- Page 132 and 133:
Parameter Setting Select unchecked
- Page 134 and 135:
Looping, Feedback Several Kyma Soun
- Page 136 and 137:
MIDIVoice Scripts The MIDIVoice and
- Page 138 and 139:
Random Events The next example gene
- Page 140 and 141:
The first line is just a declaratio
- Page 142 and 143:
EventMix Play the example called ou
- Page 144 and 145:
Markov Chain In Kyma, the MarkovCha
- Page 146 and 147:
Recursion First we create a TimedEv
- Page 148 and 149:
Morphing Imagine a scene from your
- Page 150 and 151:
Single Musical Tones You can also m
- Page 152 and 153:
Adjust the fader upwards until you
- Page 154 and 155:
III. Synchronizing the Analyses At
- Page 156 and 157:
Output MIDI Getting Wired MIDI Note
- Page 158 and 159:
Generating MIDI If you want to turn
- Page 160 and 161:
Note that if you decide to switch t
- Page 162 and 163:
Playing Back Samples from the Capyb
- Page 164 and 165:
Scripts OK, now for a verbal explan
- Page 166 and 167:
every 256 samples, it outputs the s
- Page 168 and 169:
Stereo Placement If a sound source
- Page 170 and 171:
Tap Tempo This file contains exampl
- Page 172 and 173:
Time Scaling This section is the du
- Page 174 and 175:
Timing Clock, MTC When you use Kyma
- Page 176 and 177:
faster rate than once per second! D
- Page 178 and 179:
Timbre Like an amplitude envelope,
- Page 180 and 181:
will output 256 tracks on each fram
- Page 182 and 183:
Tuning In Kyma, the smallest change
- Page 184 and 185:
Click the Create Example button; Ky
- Page 186 and 187:
Group-additive Synthesis In additiv
- Page 188 and 189:
Whooshes, Hits, Bys These are some
- Page 190 and 191:
You have defined a general stereo l
- Page 192 and 193:
Click in a light area to draw a dar
- Page 194 and 195:
First, in the Class Description fie
- Page 196 and 197:
Now your script should look like th
- Page 198 and 199:
Now use a continuous control on the
- Page 200 and 201:
Now let’s make a transformation t
- Page 202 and 203:
Part III: Exercises Time/frequency
- Page 204 and 205:
Creating a Wavetable using the Samp
- Page 206 and 207:
Kyma Quick Reference System Prototy
- Page 208 and 209:
Working with the Parameter Fields o
- Page 210 and 211:
Specifying Units in Parameter Field
- Page 212 and 213:
Virtual Control Surface The axes of
- Page 214 and 215:
Spectrum Editor Overview Navigating
- Page 216 and 217:
Sample File Editor This box indicat
- Page 218 and 219:
Prototypes Reference
- Page 220 and 221:
ADSR Envelopes & Control Signals Ca
- Page 222 and 223:
AnalogSequencer Sequencers Category
- Page 224 and 225:
#(!Morph 0 0.25 1) #(!Pan 0 0.5 1)
- Page 226 and 227:
Annotation Variables & Annotation C
- Page 228 and 229:
ArcTan Math Category The output of
- Page 230 and 231:
AudioInput Sampling Category An Aud
- Page 232 and 233:
CellularAutomaton Scripts Category
- Page 234 and 235:
CenteringMixer Mixing & Panning Cat
- Page 236 and 237:
ChannelJoin Mixing & Panning Catego
- Page 238 and 239:
Chopper Envelopes & Control Signals
- Page 240 and 241:
ContextFreeGrammar Scripts Category
- Page 242 and 243:
Crossfade Level, Compression, Expan
- Page 244 and 245:
Interpolation When Linear is select
- Page 246 and 247:
DiskCache Sampling Category Stores
- Page 248 and 249:
DiskRecorder Sampling Category Reco
- Page 250 and 251:
DynamicRangeController Level, Compr
- Page 252 and 253:
EndTogetherMixer Mixing & Panning C
- Page 254 and 255:
FeedbackLoopInput Xtra Category A F
- Page 256 and 257:
FFT Spectral Analysis FFT Category
- Page 258 and 259:
Feedback The higher the Feedback, t
- Page 260 and 261:
FormantBankOscillator Xtra Sources
- Page 262 and 263:
FrequencyTracker Tracking Live Inpu
- Page 264 and 265:
FunctionGenerator Envelopes & Contr
- Page 266 and 267:
GAOscillators Xtra Sources Category
- Page 268 and 269:
GenericSource Xtra Sources Category
- Page 270 and 271:
To specify a constant duration, no
- Page 272 and 273:
GraphicEQ Filters Category This giv
- Page 274 and 275:
HighShelvingFilter Filters Category
- Page 276 and 277:
IteratedWaveshaper Distortion & Wav
- Page 278 and 279:
the samples to be mapped. LoFreq Lo
- Page 280 and 281:
LiveSpectralAnalysis Tracking Live
- Page 282 and 283:
LowShelvingFilter Filters Category
- Page 284 and 285:
Matrix8 Spatializing Category This
- Page 286 and 287:
MemoryWriter Sampling Category When
- Page 288 and 289:
MIDIFileEcho MIDI Out Category This
- Page 290 and 291:
MIDI file). Set Channel to 0 to use
- Page 292 and 293:
MIDIOutputController MIDI Out Categ
- Page 294 and 295:
MIDIOutputEventInBytes MIDI Out Cat
- Page 296 and 297:
Polyphony Number of simultaneous MI
- Page 298 and 299:
Mixer Mixing & Panning Category Add
- Page 300 and 301:
MultifileDiskPlayer Sampling Catego
- Page 302 and 303:
Multisample Sampling Category This
- Page 304 and 305:
MultisegmentEnvelope Envelopes & Co
- Page 306 and 307:
Noise Xtra Sources Category This ge
- Page 308 and 309:
actualFreq := Frequency + (Frequenc
- Page 310 and 311:
OscilloscopeDisplay Tracking Live I
- Page 312 and 313:
Output8 Spatializing Category This
- Page 314 and 315:
Pan Mixing & Panning Category Place
- Page 316 and 317:
PeakDetector Tracking Live Input Ca
- Page 318 and 319:
PresenceFilter Filters Category Act
- Page 320 and 321:
Product Math Category Outputs the p
- Page 322 and 323:
When reset is nonzero, it resets th
- Page 324 and 325:
QuadOscillator Xtra Sources Categor
- Page 326 and 327:
0 (maximum attenuation) !Fader1 (co
- Page 328 and 329:
ReverbSection Reverb, Delay, Feedba
- Page 330 and 331:
RhythmicCellularAutomaton Scripts C
- Page 332 and 333:
RunningMax Math Category Output is
- Page 334 and 335:
Sample Sampling Category Plays the
- Page 336 and 337:
SampleAndHold Sampling Category A S
- Page 338 and 339:
Pan This is the stereo position of
- Page 340 and 341:
ScaleAndOffset Math Category The ou
- Page 342 and 343:
Controls the level of the SideChain
- Page 344 and 345:
0 (maximum attenuation) !Fader1 (co
- Page 346 and 347:
SetRange Math Category This maps th
- Page 348 and 349:
SingleSideBandRM Frequency & Time S
- Page 350 and 351:
SoundCollectionVariable Variables C
- Page 352 and 353:
SpectralShape Spectral Sources Cate
- Page 354 and 355:
SpectrumFrequencyScale Spectral Mod
- Page 356 and 357:
SpectrumLogToLinear Spectral Modifi
- Page 358 and 359:
FreqHysteresis Enter a frequency or
- Page 360 and 361:
SpectrumOnDisk Spectral Sources Cat
- Page 362 and 363:
SqrtMagnitude Math Category This is
- Page 364 and 365:
StereoInOutput8 Spatializing Catego
- Page 366 and 367:
StereoMix4 Mixing & Panning Categor
- Page 368 and 369:
SumOfSines Xtra Sources Category Re
- Page 370 and 371:
exact time within the sample where
- Page 372 and 373:
smallest array will be used, and an
- Page 374 and 375:
every other value of this Sound wil
- Page 376 and 377:
Threshold Tracking Live Input Categ
- Page 378 and 379:
TimeFrequencyScale Frequency & Time
- Page 380 and 381:
TimeOffset Time & Duration Category
- Page 382 and 383:
TriggeredSampleAndHold Sampling Cat
- Page 384 and 385:
TunableVocoder Filters Category Tun
- Page 386 and 387:
TwoFormantElement Filters Category
- Page 388 and 389:
full amplitude use +1.0 or -1.0; an
- Page 390 and 391:
VCA Envelopes & Control Signals Cat
- Page 392 and 393:
LowCF This is the center frequency
- Page 394 and 395:
TimeConstant Controls the reaction
- Page 396 and 397:
WarpedTimeIndex Time & Duration Cat
- Page 398 and 399:
398
- Page 400 and 401:
Compression/Expansion Gain 265 Cros
- Page 402 and 403:
Math Difference 245 Math Equality 2
- Page 404 and 405:
Spatializing Output8 312 Spatializi
- Page 406 and 407:
406
- Page 408 and 409:
DiskCache Disk 246 DiskPlayer Sampl
- Page 410 and 411:
Mixer Distortion & Waveshaping 298
- Page 412 and 413:
SpectrumInRAM Spectral Sources 355
- Page 414 and 415:
414
- Page 416 and 417:
416
- Page 418 and 419:
Menu Operations The menus available
- Page 420 and 421:
About the table: ♦ File Descripti
- Page 422 and 423:
File menu: Close File menu: Save…
- Page 424 and 425:
For more information, see Virtual C
- Page 426 and 427:
Edit menu: Undo Edit menu: Cut Edit
- Page 428 and 429:
Edit menu: Trim The Trim operation
- Page 430 and 431:
♦ Icon Size in Sound Editor Field
- Page 432 and 433:
♦ If the file name has a complete
- Page 434 and 435:
Time and Time Code Displays The tim
- Page 436 and 437:
speeds that may be compatible with
- Page 438 and 439:
Even if the selected Sound cannot p
- Page 440 and 441:
Info menu: Describe sound Describe
- Page 442 and 443:
Tools Menu FFT and the window funct
- Page 444 and 445:
Using the Tool Choose Spectral Anal
- Page 446 and 447:
If you are unsure which type of fil
- Page 448 and 449:
If you hear clipping in the resynth
- Page 450 and 451:
The Tool performs an analysis that
- Page 452 and 453:
The main page of the Tool contains
- Page 454 and 455:
Clicking on Cents Scale brings up t
- Page 456 and 457:
This part of the tool reads lines f
- Page 458 and 459:
System Prototypes and the Sound Fil
- Page 460 and 461:
Creating and Editing Sounds In Kyma
- Page 462 and 463:
Clicking the arrow tab on Vocoder1,
- Page 464 and 465:
You can adjust the layout of the si
- Page 466 and 467:
Double-click a Sound in the signal
- Page 468 and 469:
An envelope breakpoint field is use
- Page 470 and 471:
Specifying Numbers You specify numb
- Page 472 and 473:
Event Values, Virtual Control Surfa
- Page 474 and 475:
Event Sources are specified by prec
- Page 476 and 477:
By default, Sounds in hot parameter
- Page 478 and 479:
Booleans The real-time evaluator ca
- Page 480 and 481:
Symbolic Times and Frequencies Use
- Page 482 and 483:
Event Value via the MIDI input of t
- Page 484 and 485:
Defining a controller type in the g
- Page 486 and 487:
Because the compiled Sounds do not
- Page 488 and 489:
Display Amplitude Envelopes F10 Joi
- Page 490 and 491:
Markers F5 F6 F7 F8 You can use mar
- Page 492 and 493:
492
- Page 494 and 495:
Exporting, Importing and Post-Proce
- Page 496 and 497:
The icon buttons perform actions th
- Page 498 and 499:
enter the length of time you want t
- Page 500 and 501:
Feedback Typically, you use the Fee
- Page 502 and 503:
expands the display in the time dir
- Page 504 and 505:
that can be used as waveshapers by
- Page 506 and 507:
Internal oo These are used internal
- Page 508 and 509:
Windows Pythag These are symmetric
- Page 510 and 511:
Variables By introducing variables,
- Page 512 and 513:
Playing a Lifted Sound Environments
- Page 514 and 515:
Comments Variables Binary messages
- Page 516 and 517:
Arithmetic Operations Besides the u
- Page 518 and 519:
Booleans Alternatively, you can pla
- Page 520 and 521:
Conditionals i := 0. [i 1 s) varIf
- Page 522 and 523:
Scripting MIDI Scripts There are tw
- Page 524 and 525:
Sequences and Mixes An EventSequenc
- Page 526 and 527:
MIDIFileInterpreter Events With a M
- Page 528 and 529:
Variables could be rewritten as a l
- Page 530 and 531:
As a final illustration, let’s ta
- Page 532 and 533:
If you click OK, the program will p
- Page 534 and 535:
The next example is called Serial E
- Page 536 and 537:
The Class Editor In the course of d
- Page 538 and 539:
its range of legal values, its defa
- Page 540 and 541:
Organizing the New Classes To keep
- Page 542 and 543:
midiFileName any legal MIDI file na
- Page 544 and 545:
snd duration: (1.0 / snd frequency
- Page 546 and 547:
Suppose you had a ParameterTransfor
- Page 548 and 549:
Background Materials Reference Book
- Page 550:
Conferences Journals Magazines IEEE