- Page 1 and 2:
VEROFFENTLICHUNGEN AUS DEM UBERSEE-
- Page 3 and 4:
i 1 THE OPEN DOOR POLICY OF LIBERIA
- Page 5 and 6:
DE.B1CA710N For £IA. Together we s
- Page 7 and 8:
Vll CHAPTER 3: (continued) Page The
- Page 9 and 10:
ix CHAPTER 9: THE FORESTRY SECTOR P
- Page 11 and 12:
Footnotes Annexes Bibliography Inde
- Page 13 and 14:
xiii National Iron Ore Company, the
- Page 15 and 16:
XV China at the end of the 19th cen
- Page 17 and 18:
xvii economically more developed co
- Page 19 and 20:
XIX blancs, dans le developpement d
- Page 21 and 22:
XXI des Liberiens de toutes les cla
- Page 23 and 24:
xxiii DE OPEN DEUR POLITIEK VAN LIB
- Page 25 and 26:
XXV deze scheiding tussen kustgebie
- Page 27 and 28:
personeel - niet opgewassen was en
- Page 29 and 30:
\ I.M.F. i \ INTRUSCO i i j I.T.C.
- Page 31 and 32:
xxxi LIST OF FIGURES, MAPS, CHARTS
- Page 33 and 34:
TABLES (continued) Page 33 Planned
- Page 35:
XXXV TABLES (continued) 68 Exports
- Page 38 and 39:
II century, notably the Open Door P
- Page 40 and 41:
IV earth in Liberia. It had been th
- Page 42 and 43:
VI Tubman was very well aware of th
- Page 44 and 45:
VIII MAP 1
- Page 46 and 47:
exporters. It has attracted more th
- Page 48 and 49:
XII the more so, since no comprehen
- Page 50 and 51:
XIV development of rural Liberia, i
- Page 52 and 53:
XVI Firestone's financial contribut
- Page 54 and 55:
XVIII officer who had served in Lib
- Page 56 and 57:
XX Chapter 11 pays attention to one
- Page 59 and 60:
CHAPTER 1 THE PEPPER COAST BEFORE 1
- Page 61 and 62:
-3- "Malagueta Coast" or "Pepper Co
- Page 63 and 64:
-5- embarrassment towards a (growin
- Page 65 and 66:
in honor of the 5th President of th
- Page 67 and 68:
Numerous colonists from the U.S.A.
- Page 69 and 70:
-11- Figure 1
- Page 71 and 72:
-13- The'vicious circle started wit
- Page 73 and 74:
-15- the other - to the disadvantag
- Page 75 and 76:
-17- Of the colonists notably the A
- Page 77 and 78:
-19- The closing of the Door: The E
- Page 79 and 80:
-21- Consequently, both tribal peop
- Page 81 and 82:
The Roye Administration -23- The te
- Page 83 and 84:
-25- He also wanted the general edu
- Page 85 and 86:
-27- territory Liberia claimed by E
- Page 87 and 88:
m -29- The commission created in 18
- Page 89 and 90:
-31- re-activating the first conces
- Page 91 and 92:
-33- European. Its expense paid Ly
- Page 93 and 94:
-35- Treasury and an unfavourable e
- Page 95 and 96:
-37- their salaries. The resulting
- Page 97 and 98:
-39- Therefore President Howard of
- Page 99 and 100:
j -41- :j % One of the recommendati
- Page 101 and 102:
-43- twentieth century the Presiden
- Page 103 and 104:
-45- The British and French absence
- Page 105 and 106:
-47- In December 1923 the first mis
- Page 107 and 108:
-49- and he proposed the constructi
- Page 109 and 110:
-51- itself, upon acceptance of the
- Page 111 and 112:
-53- equal to 4 per cent of the cou
- Page 113 and 114:
-55- between the U.S.A. and Liberia
- Page 115 and 116:
-57- Government of Liberia agreed w
- Page 117 and 118:
-59- The expansion of the governmen
- Page 119 and 120:
-61- Another disagreement arose ove
- Page 121 and 122:
] -63- J Notes: ? : :i (1) Fireston
- Page 123 and 124:
-65- question had never been adequa
- Page 125 and 126:
-67- had varied from $ 8 million to
- Page 127 and 128:
-69- In order to protect the new co
- Page 129 and 130:
-71- capacity of 55,000 tyres, requ
- Page 131 and 132:
J -73j :i quantities of dry rubber
- Page 133 and 134:
-75- The charge of 3.44 cents per p
- Page 135 and 136:
-77- Finance in the 1970's, but owi
- Page 137 and 138:
-79- Planting Agreement was in Akro
- Page 139 and 140:
-81- on the basis of competitive pr
- Page 141 and 142:
-83- with the 7iresione Plantation
- Page 143 and 144:
-85- 1. Organization of a national
- Page 145 and 146:
-87- However, before he could reali
- Page 147 and 148:
-89- operation of the plantation. T
- Page 149 and 150:
j -91- i have taxed the portion of
- Page 151 and 152:
-93- in 1947, but also entrusted hi
- Page 153 and 154:
-95- company's main interest is no
- Page 155 and 156:
-97- poration for the period 1963 -
- Page 157 and 158:
-99- TABLE 4 LIBERIA COMPANY'S DIVI
- Page 159 and 160:
-101- 6 cents per acre had to be pa
- Page 161 and 162:
The Port near Greenville -103- Afte
- Page 163 and 164:
-105- rubber. Little is known of th
- Page 165 and 166:
-107- the management of the company
- Page 167 and 168:
j -109- } S taxes or imposts of any
- Page 169 and 170:
-111- The concession agreement, wit
- Page 171 and 172:
-113- concluded with other foreign
- Page 173 and 174:
-115- which is owned by a political
- Page 175 and 176:
-117- owners of the concession. The
- Page 177 and 178:
-119- eleven persons were: Vice-Pre
- Page 179 and 180:
-121- tain rights in cooperation wi
- Page 181 and 182:
-123- It is significant that despit
- Page 183 and 184:
-125- scribed above., providing suc
- Page 185 and 186:
-127- materials, the rights of the
- Page 187 and 188:
-129- the possibilities offered by
- Page 189 and 190:
I -131- sion, and sales to affiliat
- Page 191 and 192:
-133- concession area of 100,000 ac
- Page 193 and 194:
-135- such payments out of profit,"
- Page 195 and 196:
-137- tually all of these companies
- Page 197 and 198:
-139- The 1898 concession agreement
- Page 199 and 200:
-141- Normann, from England, which
- Page 201 and 202:
-143- to the English "Providence Mi
- Page 203 and 204:
-145- the company had in previous y
- Page 205 and 206:
-147- of "Globex Minerals (inc.)",
- Page 207 and 208:
-149- the excess acreage (38) does
- Page 209 and 210:
-151- old Tchien and Gbaepo Distric
- Page 211 and 212:
-153- only two of them referred to
- Page 213 and 214:
-155- not provide for a price of go
- Page 215 and 216:
-157- Meanwhile, the exploration ac
- Page 217 and 218:
-159- The excessively liberal terms
- Page 219 and 220:
-161- a concession for gold, diamon
- Page 221 and 222:
-163- difficulties which had to be
- Page 223 and 224:
-165- of 50? and which was of direc
- Page 225 and 226:
-167- The concessionaire became exe
- Page 227 and 228:
-169- These statements of the two s
- Page 229 and 230:
-171- Note that until i960 L.M.C.'s
- Page 231 and 232:
-173- salaries to ex-patriate perso
- Page 233 and 234:
-175- the - increased - capacity of
- Page 235 and 236:
-177- '••:] Sales Agreement bet
- Page 237 and 238:
-179- On January 3, 1963 a Memorand
- Page 239 and 240:
-181- L.M.C. would have acted in co
- Page 241 and 242:
-183- area described as the Bea Mou
- Page 243 and 244:
-185- Agreement signed by represent
- Page 245 and 246:
-187- geologists, economists and la
- Page 247 and 248:
CHRONOLOGY SUMMARIZED HISTORY OF L.
- Page 249 and 250:
-191- N.I.O.C. dated January 1, 196
- Page 251 and 252:
Year 1962 1963 1964 1965 1966 1967
- Page 253 and 254:
-195- for further details of the 19
- Page 255 and 256:
-197- soon demonstrated by the call
- Page 257 and 258:
-199- of 3.2 million long tons in a
- Page 259 and 260:
-201- TABLE 10 FINANCIAL OBLIGATION
- Page 261 and 262:
-203- achievements were made in spi
- Page 263 and 264:
-205- After the change of the name
- Page 265 and 266:
-207- to concentrate on the new fin
- Page 267 and 268:
-209- one steel factory, in the cou
- Page 269 and 270:
-211- The Liberian Government owns
- Page 271 and 272:
-213- 1952, legal ownership of abou
- Page 273 and 274:
-215- Th is second part of the conc
- Page 275 and 276:
-217- one of its sixteen Swedish su
- Page 277 and 278:
-219- For these services G.I.M. is
- Page 279 and 280:
-221- Prior to 1974 fifty per cent
- Page 281 and 282:
-223- depreciation of (capital) equ
- Page 283 and 284:
-225- of the revision of the 1960 M
- Page 285 and 286:
i -227- 3 prescribing such a review
- Page 287 and 288:
-229- But now, having accepted bein
- Page 289 and 290:
-231- As a result of this review in
- Page 291 and 292:
-233- TABLE 14 FINANCIAL COSTS OF C
- Page 293 and 294:
DELIMCO/B.M.C. -235- Long-standing
- Page 295 and 296:
-237- equity participation (unlike
- Page 297 and 298:
Year 1965 1966 1967 1968 1969 1970
- Page 299 and 300:
-241- these funds to B.M.C. in the
- Page 301 and 302:
-243- negotiations which were held
- Page 303 and 304:
-245- S ources: - "Technical Inform
- Page 305 and 306:
-247- Prices of sales to affiliated
- Page 307 and 308:
S ource: -249- TABLE 17 INVESTMENTS
- Page 309 and 310:
-251- due time a mining concession
- Page 311 and 312:
-253- The 1967 concession agreement
- Page 313 and 314:
-255- Changes of the concession agr
- Page 315 and 316:
-257- Some reasons why the Wologisi
- Page 317 and 318:
-259- CHAPTER 9 THE FORESTRY SECTOR
- Page 319 and 320:
-261- Surveys of Liberia's Forest P
- Page 321 and 322:
-263- (see below) repealed the port
- Page 323 and 324:
-265- were authorized to issue perm
- Page 325 and 326:
-267- TABLE 18 LIBERIA'S NATIONAL F
- Page 327 and 328:
-269- The Forestry Development Auth
- Page 329 and 330:
-271- TABLE 19 TIMBER CONCESSIONS G
- Page 331 and 332:
-273- TABLE 20 PRODUCTION OF TIMBER
- Page 333 and 334:
-275- Souree: - Annual Report, Depa
- Page 335 and 336:
-277- Attempts To Establish A Natio
- Page 337 and 338:
YEAR 1967 1968 1969 1970 1971 1972
- Page 339 and 340:
-281- As a consequence the export v
- Page 341 and 342:
-283- December 31, 1977 Liberia lev
- Page 343 and 344:
Botanical Name Category 1 Ent, cyli
- Page 345 and 346:
-287- these 33 companies; year of s
- Page 347 and 348:
-289- were also the principal share
- Page 349 and 350:
-291- alleged corruption involving
- Page 351 and 352:
-293- It is important to note here
- Page 353 and 354:
CHAPTER 10 -295- FISCAL PERFORMANCE
- Page 355 and 356: -297- expenditures in the period pr
- Page 357 and 358: -299- In these years the debt servi
- Page 359 and 360: -301- TABLE 28-A COMPARATIVE STATEM
- Page 361 and 362: -303- the second half of the 1930's
- Page 363 and 364: -305- first to benefit from this U.
- Page 365 and 366: M -307- •' \ •:i TABLE 30 fSS]
- Page 367 and 368: -309- Government Revenues 1941 - 19
- Page 369 and 370: TABLE 31-B MAIN SOURCES OF DOMESTIC
- Page 371 and 372: -313- situation renders the Treasur
- Page 373 and 374: -315- The trend of public expenditu
- Page 375 and 376: -317- •• \ During the 1950 's t
- Page 377 and 378: -319- $ 117 million were due for re
- Page 379 and 380: -321- In 1943 Liberia and the U.S.A
- Page 381 and 382: Sector -323- TABLE 33 PLANNED EXPEN
- Page 383 and 384: Type of Assistance I. Economic Asst
- Page 385 and 386: THE 1963 - 1978 PERIOD Revenue Perf
- Page 387 and 388: Year 1963 1964 1965 1966 1967 1968
- Page 389 and 390: Year 1963 1964 1965 1966 1967 1968
- Page 391 and 392: 1963 1964 1965 1966 1967 1968 1969
- Page 393 and 394: -335- of the Ministry of Finance wh
- Page 395 and 396: -337- Development Planning and Expe
- Page 397 and 398: 1.1 Agriculture 2.1 Rural Roads 2.2
- Page 399 and 400: -341- The Plan which was approved b
- Page 401 and 402: -343- "Uhile the performance of the
- Page 403 and 404: -345- TABLE 43 PLANNED DEVELOPMENT
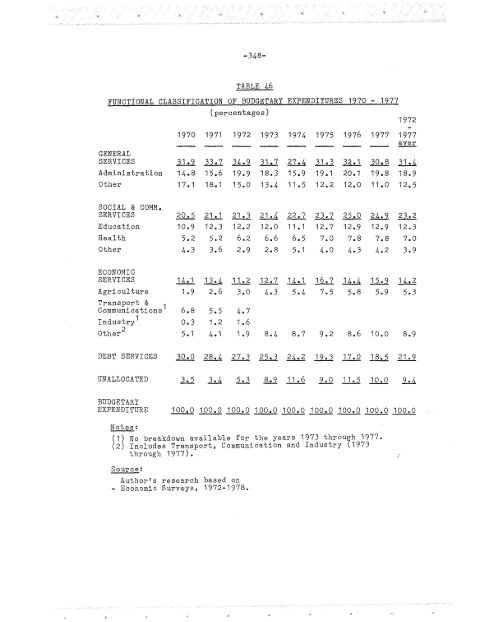
- Page 405: -347- The unenvisaged expenditures
- Page 409 and 410: 1964 1965 1966 1967 1968 1969 1970
- Page 411 and 412: Note: (1) Preliminary figures. Auth
- Page 413 and 414: -355- Bushrod Island; a new bridge
- Page 415 and 416: -357- TABLE 51 U.H. ASSISTANCE TO L
- Page 417 and 418: -359- happened in a haphazard way.
- Page 419 and 420: -361- The (investment) activities o
- Page 421 and 422: -363- '••] the most organized a
- Page 423 and 424: -365- exploited this situation by s
- Page 425 and 426: -367- all offered staff positions o
- Page 427 and 428: -369- allied to the Tolbert clan bu
- Page 429 and 430: -371- history, secrets and traditio
- Page 431 and 432: -373- At the time of the arrival of
- Page 433 and 434: -375- The very few books which inde
- Page 435 and 436: GOVERNMENT. MISSION. PRIVATE. TRIBA
- Page 437 and 438: -379- TABLE 54 1962 POPULATION AND
- Page 439 and 440: -381- about 19,000 were between 5 a
- Page 441 and 442: -383- Liberia College in 1862. Elem
- Page 443 and 444: -385- mark of 70$. This shocking an
- Page 445 and 446: -387- The 1978 National Education S
- Page 447 and 448: -389- TABLE 58-B SCHOOL ATTENDING P
- Page 449 and 450: -391- TABLE 60 A. NUMBER OF STUDENT
- Page 451 and 452: -393- It seems likely that the rela
- Page 453 and 454: -395- Author's research based on th
- Page 455 and 456: CHAPTER 12 -397- TRANSPORTATION AND
- Page 457 and 458:
-399- It thus facilitated the immed
- Page 459 and 460:
-401- how many people were employed
- Page 461 and 462:
GEOGRAPHICAL DISTRIBUTION OF COUNTY
- Page 463 and 464:
-405- in Liberia was owned, finance
- Page 465 and 466:
-407- TABLE 65 ABSOLUTE AND RELATIV
- Page 467 and 468:
-409- were politically well covered
- Page 469 and 470:
-411- railroad which, with the exce
- Page 471 and 472:
-413- the concession sector (LAMCO)
- Page 473 and 474:
-415- 5 seater twin-engined Cessna
- Page 475 and 476:
-417- Besides, this segment of the
- Page 477 and 478:
-419- The telecommunication relay s
- Page 479 and 480:
-421- with Germany and hence affect
- Page 481 and 482:
-423- :: The 1960 - 1979 Period j F
- Page 483 and 484:
-425- with Sierra Leone is less tha
- Page 485 and 486:
-427- alarming (see Chapter 10), th
- Page 487 and 488:
-429- structural changes and the de
- Page 489 and 490:
-431- from roughly one third in 197
- Page 491 and 492:
-433- by Fouad Khalifa, a Lebanese,
- Page 493 and 494:
-435- The Government indebted itsel
- Page 495 and 496:
-437- a very large part of G.D.P. i
- Page 497 and 498:
-439- to the distribution of power,
- Page 499 and 500:
-441- heard. As early as 1830, but
- Page 501 and 502:
-U3- was wrongly thought in those d
- Page 503 and 504:
-445- 1962. In the 1950's the triba
- Page 505 and 506:
-447- Tubman Estate (66). Interesti
- Page 507 and 508:
-449- National Legislature, This de
- Page 509 and 510:
-451- The creation of state owned c
- Page 511 and 512:
-453- respect to foreign concession
- Page 513 and 514:
-455- II. The Government of Liberia
- Page 515 and 516:
-457- Most notable among these clau
- Page 517 and 518:
-459- ADDENDUM On April 12, 1980, a
- Page 519:
ISBN 3-88299-040-6 ISSN 0344-4317