

Cash or Card: Consumer Perceptions of Payment Modes - Scholarly ...
Cash or Card: Consumer Perceptions of Payment Modes - Scholarly ...
Cash or Card: Consumer Perceptions of Payment Modes - Scholarly ...

Create successful ePaper yourself
Turn your PDF publications into a flip-book with our unique Google optimized e-Paper software.
6.4.2: Pre-Test Two - Internal Consistency Assessment<br />
In terms <strong>of</strong> test-retest reliability the scale was re-administered to 259 people 2-21 days after<br />
its first administration. The first pre-test indicate overall reliability was Cronbach .892 and<br />
second pre-test was 0.843. The purpose <strong>of</strong> test-retest reliability shows how constant sc<strong>or</strong>es<br />
remain from one occasion to another. The rationale underlying reliability determinations <strong>of</strong><br />
this type is that if a measure truly reflects some meaningful construct, it should assess that<br />
construct comparably on separate occasion (De Vellis, 2003).<br />
In terms <strong>of</strong> test-retest reliability the scale was re-administered to 259 people 2-14 days after<br />
its first administration. Overall reliability f<strong>or</strong> Pretest One was Cronbach .892 and the second<br />
Pretest was 0.843. The purpose <strong>of</strong> test-retest reliability is to show constancy <strong>of</strong> response<br />
across tests. The test-retest result shows a Pearson c<strong>or</strong>relation <strong>of</strong> .699 with statistically<br />
significant responses. The rationale underlying reliability determinations <strong>of</strong> this type is that if<br />
a measure truly reflects some meaningful construct, it should assess that construct<br />
comparably on separate occasion (De Vellis, 2003).<br />
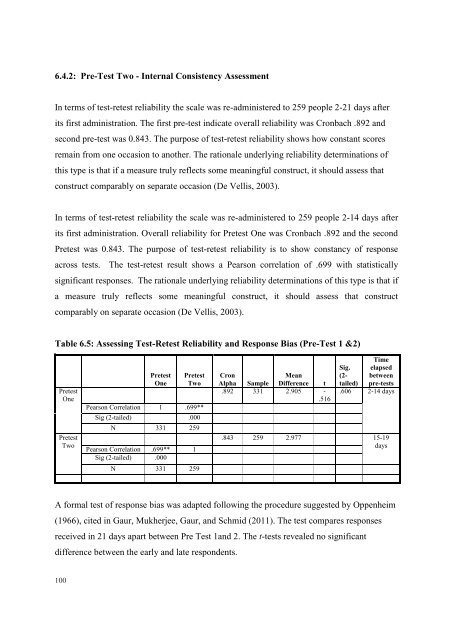
Table 6.5: Assessing Test-Retest Reliability and Response Bias (Pre-Test 1 &2)<br />
Pretest<br />
One<br />
Pretest<br />
Two<br />
100<br />
Pretest<br />
One<br />
Pretest<br />
Two<br />
Pearson C<strong>or</strong>relation 1 .699**<br />
Sig (2-tailed) .000<br />
N 331 259<br />
Pearson C<strong>or</strong>relation .699** 1<br />
Sig (2-tailed) .000<br />
N 331 259<br />
Cron<br />
Mean<br />
Alpha Sample Difference t<br />
.892 331 2.905 -<br />
.516<br />
Sig.<br />
(2tailed)<br />
Time<br />
elapsed<br />
between<br />
pre-tests<br />
.606 2-14 days<br />
.843 259 2.977 15-19<br />
days<br />
A f<strong>or</strong>mal test <strong>of</strong> response bias was adapted following the procedure suggested by Oppenheim<br />
(1966), cited in Gaur, Mukherjee, Gaur, and Schmid (2011). The test compares responses<br />
received in 21 days apart between Pre Test 1and 2. The t-tests revealed no significant<br />
difference between the early and late respondents.


