0 GRUPO CASA SABA, S.A.B. DE C.V. Paseo de la Reforma 215 ...
0 GRUPO CASA SABA, S.A.B. DE C.V. Paseo de la Reforma 215 ...
0 GRUPO CASA SABA, S.A.B. DE C.V. Paseo de la Reforma 215 ...

You also want an ePaper? Increase the reach of your titles
YUMPU automatically turns print PDFs into web optimized ePapers that Google loves.
a) Información Financiera Seleccionada:<br />
3) INFORMACION FINANCIERA<br />
Las cifras <strong>de</strong> 2007, 2008, 2009, 2010 y 2011 están expresadas en millones <strong>de</strong> pesos nominales. Las<br />
cifras pue<strong>de</strong>n variar por redon<strong>de</strong>o<br />
Información al 31 <strong>de</strong> Diciembre <strong>de</strong> 2007 2008 2009 2010 2011<br />
Estado <strong>de</strong> Resultados<br />
(Miles <strong>de</strong> Pesos y Dó<strong>la</strong>res salvo información por acción)<br />
Ventas Netas 25,259,662 28,400,059 29,791,657 33,840,754 46,568,226<br />
Utilidad Bruta 2,484,257 3,065,588 3,225,855 4,527,791 8,774,219<br />
Gastos <strong>de</strong> Operación 1,424,852 2,104,883 2,335,130 3,853,139 7,207,752<br />
Utilidad <strong>de</strong> Operación 1,059,405 960,705 890,725 674,652 1,566,467<br />
Costo Integral <strong>de</strong> Financiamiento 17,848 181,118 262,243 262,240 1,040,060<br />
Otros (ingresos) (2) 51,756 58,189 -136,307 -97,131 -132,400<br />
Utilidad antes <strong>de</strong> impuestos y PTU 1,093,313 897,567 492,175 318,181 400,169<br />
Utilidad Neta 905,087 595,118 280,278 270,070 76,985<br />
Utilidad Neta (Pérdida) por acción 3.41 2.24 1.05 1.017 0.33<br />
Promedio Pon<strong>de</strong>rado <strong>de</strong> Acciones en Circu<strong>la</strong>ción (miles)<br />
(3)<br />
Ba<strong>la</strong>nce General<br />
265,419<br />
58<br />
265,419 265,419 265,419<br />
265,419<br />
Propieda<strong>de</strong>s, P<strong>la</strong>nta y Equipo Neto 1,269,821 1,404,985 1,400,188 3,534,551 3,406,855<br />
Activo Total (Neto) 12,039,715 14,647,532 15,087,669 31,312,711 32,094,059<br />
Deuda Corto P<strong>la</strong>zo 271,824 1,419,126 9,195,340 3,050,826<br />
Deuda <strong>de</strong> Largo P<strong>la</strong>zo 1,053,000 891,644 2,289,346 9,505,715<br />
Capital Social 1,123,764 1,123,764 1,123,764 1,123,764 1,123,764<br />
Capital Contable 6,092,720 6,609,761 6,651,209 7,082,848 7,107,767<br />
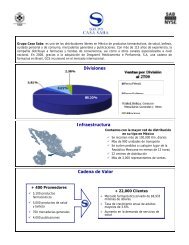
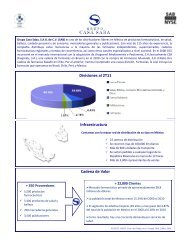
A continuación se presentan algunos rubros como porcentaje al total <strong>de</strong> ventas:<br />
A 31 <strong>de</strong> diciembre <strong>de</strong>:<br />
2009 2010 2011<br />
Farma:<br />
Sector Privado (1) (2) 75.11% 71.91% 46.16%<br />
Gobierno 3.04% 2.83% 2.60%<br />
Salud, Belleza, Consumo, Merca<strong>de</strong>rías Generales y Otros 8.49% 6.42% 5.20%<br />
Publicaciones 2.53% 2.47% 1.70%<br />
Farmacias 10.82% 16.36% 44.34%<br />
TOTAL 100.00% 100.00% 100.00%