- Page 1 and 2:
UNIVERSIDADE DE SÃO PAULO PROGRAMA
- Page 3:
AUTORIZO A REPRODUÇÃO E DIVULGAÇ
- Page 6 and 7:
“If you think you can do a thing
- Page 8 and 9:
RESUMO RAMOS, J. E. Universalizaç
- Page 10 and 11:
ABSTRACT RAMOS, J. E. Universalizat
- Page 12 and 13:
LISTA DE FIGURAS Figura 2.1 Esquema
- Page 14 and 15:
Figura 3.18 Croquis contendo os pon
- Page 16 and 17:
Figura 5.21 Circuito representativo
- Page 18 and 19:
Figura 5.58 Operação e abertura d
- Page 20 and 21:
Tabela 4.4 Falhas de equipamentos v
- Page 22 and 23:
Tabela 5.31 Desempenho comparativo
- Page 24 and 25:
DIC: DNAEE: DPC: EAT: EGM: ELETROBR
- Page 26 and 27:
TC: Transformador de Corrente Td: T
- Page 28 and 29:
2.5.2 Isolação dos Cabos Para-Rai
- Page 30 and 31:
5.5.4 Área de Exposição - Ae....
- Page 32 and 33:
C A P Í T U L O 1 INTRODUÇÃO A u
- Page 34 and 35:
3 compostos por linhas de 230 kV, 3
- Page 36 and 37:
5 (CERON). O projeto foi desenvolvi
- Page 38 and 39:
7 encontro dos propósitos deste tr
- Page 40 and 41:
9 Assim, por utilizar os próprios
- Page 42 and 43:
11 transitórias advindas de descar
- Page 44 and 45:
13 etapa são feitas as caracteriza
- Page 46 and 47:
15 transmissão em corrente alterna
- Page 48 and 49:
17 primeiras experiências, estão
- Page 50 and 51:
19 O acoplamento capacitivo modific
- Page 52 and 53:
21 para atendimento a pequenas cida
- Page 54 and 55: 23 a) o cabo para-raios isolado e e
- Page 56 and 57: 25 cabos para-raios da LT, é um si
- Page 58 and 59: 27 que, quando a descarga atmosfér
- Page 60 and 61: 29 Ainda de acordo com os autores c
- Page 62 and 63: 31 = resistividade do solo (ohm.m)
- Page 64 and 65: 33 compensação aproximada. A mais
- Page 66 and 67: 35 • A tensão foi considerada co
- Page 68 and 69: 37 4. Sobretensões temporárias: O
- Page 70 and 71: 39 (U e ), não tem sido maior que
- Page 72 and 73: 41 2.5 Experiências com a Tecnolog
- Page 74 and 75: 43 Localidades Tabela 2.2 - Dados d
- Page 76 and 77: 45 Ainda no contexto histórico da
- Page 78 and 79: 47 A modificação da cabeça das t
- Page 80 and 81: 49 variáveis que podem impor situa
- Page 82 and 83: 51 Tabela 2.4 - Impedâncias de bal
- Page 84 and 85: 53 Figura 2.17 Esquema geral de uma
- Page 86 and 87: 55 Ainda segundo os autores citados
- Page 88 and 89: 57 Em função da corrente nominal
- Page 90 and 91: 59 Figura 2.22 Geometria da malhas
- Page 92 and 93: 61 Após várias simulações, adot
- Page 94 and 95: 63 Com relação às interrupções
- Page 96 and 97: 65 Entre todos os valores medidos n
- Page 98 and 99: C A P Í T U L O 3 MEDIÇÕES REALI
- Page 100 and 101: 69 temáticos, entre os quais o Map
- Page 102 and 103: 71 Figura 3.2 Distribuição geogr
- Page 106 and 107: 75 Para garantir uniformidade de pr
- Page 108 and 109: 77 Todas as medições de campo aqu
- Page 110 and 111: 79 4 3 3 Quantidade 2 2 2 1 1 0 0 <
- Page 112 and 113: 81 3 3 3 3 2 2 2 2 1 1 1 1 1 1 0 0
- Page 114 and 115: 83 foi priorizada, dado à expectat
- Page 116 and 117: 85 maioria das medições foi reali
- Page 118 and 119: 87 O método empregado consiste no
- Page 120 and 121: 89 recomendada a construção de mu
- Page 122 and 123: 91 este ponto e a estrutura metáli
- Page 124 and 125: 93 da Norma Std. 1159-95 do IEEE (1
- Page 126 and 127: 95 alimentadores, identificados com
- Page 128 and 129: 97 Tabela 3.7 - Medições de tens
- Page 130 and 131: 99 corrente. Na sequência, a Figur
- Page 132 and 133: C A P Í T U L O 4 ANÁLISE DAS INT
- Page 134 and 135: 103 o Informação Diária, Raciona
- Page 136 and 137: 105 No caso específico da operaç
- Page 138 and 139: 107 • Relé 51N- Este relé foi i
- Page 140 and 141: 109 ou seja, não é comprovada por
- Page 142 and 143: 111 a) Interrupções Segundo a Ori
- Page 144 and 145: 113 Código Tabela 4.1 - Codificaç
- Page 146 and 147: 115 Onde: DEC = duração equivalen
- Page 148 and 149: 117 De acordo com o boletim estatí
- Page 150 and 151: 119 Figura 4.6 Diagrama unifilar op
- Page 152 and 153: 121 Portanto, no período em que o
- Page 154 and 155:
123 Nº de Interrupções 300 250 2
- Page 156 and 157:
125 Ano Potência Instalada ( kW )
- Page 158 and 159:
127 Em Samuel, o transformador 13,8
- Page 160 and 161:
Tabela 4.7 - DEC anual de todo o si
- Page 162 and 163:
131 Em mais de 10 anos de operaçã
- Page 164 and 165:
133 Considerando-se apenas a classe
- Page 166 and 167:
135 Tabela 4.10 - Interrupções n
- Page 168 and 169:
137 acordo com a Tabela 4.2, exclui
- Page 170 and 171:
C A P Í T U L O 5 IMPACTO DAS DESC
- Page 172 and 173:
141 3. da nuvem para um ponto qualq
- Page 174 and 175:
143 Os instantes iniciais da forma
- Page 176 and 177:
145 Figura 5.5 Descargas elétricas
- Page 178 and 179:
147 De acordo com Pinto Júnior (20
- Page 180 and 181:
149 pontos de observação, cobrind
- Page 182 and 183:
151 Onde: M = mediana do parâmetro
- Page 184 and 185:
153 P(I) = é a probabilidade acumu
- Page 186 and 187:
155 S 10/90 = taxa média de cresc
- Page 188 and 189:
157 o área de cobre equivalente: 1
- Page 190 and 191:
159 S22T: Estrutura de Transposiç
- Page 192 and 193:
161 • área: 82 mm 2; • diâmet
- Page 194 and 195:
163 5.2.4 Ensaio da Cadeia de Isola
- Page 196 and 197:
165 Figura 5.17 Formas de onda de i
- Page 198 and 199:
167 É mais adequado modelar os iso
- Page 200 and 201:
169 No que diz respeito ao entorno
- Page 202 and 203:
171 utilizando-se como ferramenta o
- Page 204 and 205:
173 Figura 5.21 Circuito representa
- Page 206 and 207:
175 Tabela 5.5 - Resistências de t
- Page 208 and 209:
177 R t = Resistência de terra (Ω
- Page 210 and 211:
179 5.3.2.2 Análise dos Resultados
- Page 212 and 213:
181 A Figura 5.26a mostra o resulta
- Page 214 and 215:
183 A Figura 5.28 mostra as formas
- Page 216 and 217:
185 Adicionalmente, também foram r
- Page 218 and 219:
187 Os estudos desenvolvidos por Pi
- Page 220 and 221:
189 Onde t 0 e t 0 ’ referem-se a
- Page 222 and 223:
191 Para o componente magnético re
- Page 224 and 225:
193 corrente ao longo do canal foi
- Page 226 and 227:
195 calculada pelo ERM, uma vez que
- Page 228 and 229:
197 correntes como sendo de aproxim
- Page 230 and 231:
199 Figura 5.38 Mapa isoceráunico
- Page 232 and 233:
201 Como visto, a maioria dos estad
- Page 234 and 235:
203 Figura 5.41 Distribuição espa
- Page 236 and 237:
205 Figura 5.42 Mapa de densidade d
- Page 238 and 239:
207 serem atingidos. Se o líder de
- Page 240 and 241:
209 a) r s = 10.I 0,65 (5.31), onde
- Page 242 and 243:
211 O desenvolvimento do EGM, sobre
- Page 244 and 245:
213 R am = 14. H 0,6 (5.41), sendo
- Page 246 and 247:
215 atmosféricas originarem grande
- Page 248 and 249:
217 curto-circuita os terminais do
- Page 250 and 251:
219 Com relação à resistividade
- Page 252 and 253:
221 5.5.5.3 Corrente Crítica de Di
- Page 254 and 255:
223 Tabela 5.16 - Correntes crític
- Page 256 and 257:
225 menor espaço, constituem-se em
- Page 258 and 259:
227 Tabela 5.18 - Estimativas do n
- Page 260 and 261:
229 Na Tabela 5.20 estima-se um val
- Page 262 and 263:
231 O valor de crista da corrente d
- Page 264 and 265:
233 indutor). O procedimento para d
- Page 266 and 267:
235 Os cálculos foram realizados c
- Page 268 and 269:
237 Tabela 5.22 - Estimativa do nú
- Page 270 and 271:
239 No que diz respeito às estimat
- Page 272 and 273:
241 percebe-se que, a proporção d
- Page 274 and 275:
243 Figura 5.55 Estrutura típica d
- Page 276 and 277:
245 “Lightning-Induced OverVoltag
- Page 278 and 279:
247 Tabela 5.31 - Desempenho compar
- Page 280 and 281:
249 Assim, as interrupções totais
- Page 282 and 283:
251 NIV (4.1) = Número de interrup
- Page 284 and 285:
253 Durante todo período de opera
- Page 286 and 287:
255 mesmos e anotar quais foram as
- Page 288 and 289:
257 intra-nuvem e nuvem-solo, Faria
- Page 290 and 291:
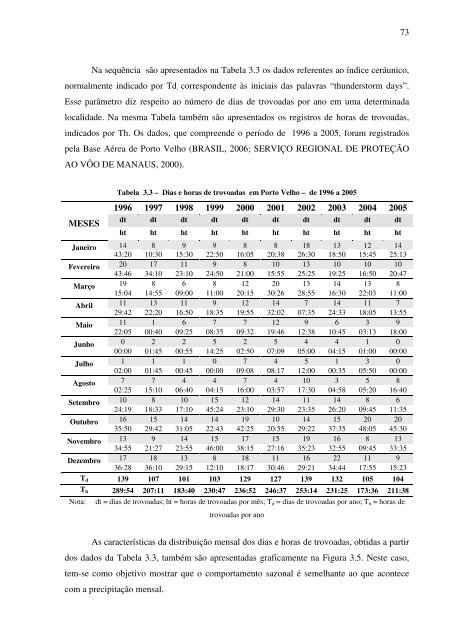
259 Tabela 5.34 - Valor médio mens
- Page 292 and 293:
261 1998 a 2005. Em relação ao n
- Page 294 and 295:
263 possível obter a distribuiçã
- Page 296 and 297:
265 O segundo motivo é uma complem
- Page 298 and 299:
267 5.6.1 Índices Operacionais Ver
- Page 300 and 301:
269 (i) = índice de interrupção
- Page 302 and 303:
271 d) Confiabilidade por consumido
- Page 304 and 305:
273 Baseados nos mesmos procediment
- Page 306 and 307:
275 particularidades da Tecnologia
- Page 308 and 309:
277 Portanto, pelo que foi demonstr
- Page 310 and 311:
279 Nº de Interrupções 180 159,9
- Page 312 and 313:
281 interrupções/ano, respectivam
- Page 314 and 315:
283 pelo Sistema PRE Itapuã. Esse
- Page 316 and 317:
285 As semelhanças no comportament
- Page 318 and 319:
287 No segundo passo, é extraída
- Page 320 and 321:
289 Tabela 5.45 - DEC, FEC e TMR de
- Page 322 and 323:
CAPÍTULO 6 CONCLUSÕES E SUGESTÕE
- Page 324 and 325:
293 com a fase cujo condutor é o s
- Page 326 and 327:
295 • na LT SMAQ, associada à li
- Page 328 and 329:
297 • a opção pelo PRE ao invé
- Page 330 and 331:
299 9. obtenção de índices opera
- Page 332 and 333:
REFERÊNCIAS BIBLIOGRÁFICAS ABB; M
- Page 334 and 335:
303 ASSOCIAÇÃO BRASILEIRA DE NORM
- Page 336 and 337:
305 ______. Relatório mensal: tran
- Page 338 and 339:
307 D’AJUZ, Ary; ROSE, Eber Hávi
- Page 340 and 341:
309 GILMAN, D. W.; WHITEHEAD, Edwin
- Page 342 and 343:
311 LIMA, Antônio G. G.; PILLOTO,
- Page 344 and 345:
313 PIANTINI, A.; JANISZEWSKI, J. M
- Page 346 and 347:
315 RAMOS, José Ezequiel. Avaliaç
- Page 348 and 349:
317 SERVIÇO REGIONAL DE PROTEÇÃO
- Page 350:
ANEXO METODOLOGIA DE CÁLCULO DO DE