- Page 1 and 2:
Karies - diagnostik, riskbedömning
- Page 3:
Karies - diagnostik, riskbedömning
- Page 6 and 7:
Primärt urval av studier 63 Bedöm
- Page 8 and 9:
Resultat 176 FOTI 176 DiFOTI 176 DI
- Page 10 and 11:
Metodik 356 Litteratursökning 356
- Page 13 and 14:
SBU:s sammanfattning och slutsatser
- Page 15 and 16:
Bakgrund Karies är en kronisk sjuk
- Page 17 and 18:
Gradering av slutsatsernas evidenss
- Page 19 and 20:
Visuell-taktil diagnostik Studier s
- Page 21 and 22:
Hur kan kariesskador predikteras me
- Page 23 and 24:
Barn (1-3 år) som borstar tändern
- Page 25 and 26:
Kostnadseffektivitet för diagnosti
- Page 27:
undersöks. Frekvensen röntgenunde
- Page 30 and 31:
sönderfall av tanden, då patiente
- Page 32 and 33:
av tandhälsan och har inga symtom.
- Page 34 and 35:
ning. Riskbedömning görs rutinmä
- Page 36 and 37:
Betydelsen av effektiv tidig behand
- Page 38 and 39:
Validitet och reliabilitet Validite
- Page 40 and 41:
negativa prediktionsvärdet (NPV) b
- Page 42 and 43:
ytterligare i Faktaruta 1.6. Exempe
- Page 44 and 45:
Samhällsnivå Sociodemografi och v
- Page 46 and 47:
Faktaruta 1.1 Olika aspekter på va
- Page 48 and 49:
Faktaruta 1.3 Fyrfältstabell med k
- Page 50 and 51:
Faktaruta 1.4 Diagram som illustrer
- Page 52 and 53:
Faktaruta 1.6 Beräkning av likelih
- Page 54 and 55:
Faktaruta 1.7 Nomogram som visar hu
- Page 56 and 57:
Referenser 1. Fiske J, Davis DM, Fr
- Page 59 and 60:
2. Metodik för sökning och utvär
- Page 61 and 62:
Primärt urval av studier För att
- Page 63 and 64:
laget för slutsatserna. En metod s
- Page 65 and 66:
• Förklarat/analyserat bortfall
- Page 67 and 68:
Otillräckligt vetenskapligt underl
- Page 69 and 70:
3. Praxisundersökning avseende bit
- Page 71 and 72:
svenska och norska tonåringar unde
- Page 73 and 74:
Totalt antal undersökta Stockholm
- Page 75 and 76:
Østfold Totalt antal undersökta %
- Page 77 and 78:
4. Diagnostik 4.1 Visuell-taktil di
- Page 79 and 80:
Bakgrund Den primära metoden för
- Page 81 and 82:
undersökare och bedömdes ha ett m
- Page 83 and 84:
diagnostik av emaljkaries på tuggy
- Page 85 and 86:
Aktiv (pågående) och inaktiv (kro
- Page 87 and 88:
Tabell 4.1.1 Inklusionskriterier f
- Page 89 and 90:
Dropout/ missing data Method or tec
- Page 91 and 92:
Dropout/ missing data Method or tec
- Page 93 and 94:
Dropout/ missing data Method or tec
- Page 95 and 96:
Dropout/ missing data Method or tec
- Page 97 and 98:
Dropout/ missing data Method or tec
- Page 99 and 100:
Dropout/ missing data Method or tec
- Page 101 and 102:
Dropout/ missing data Method or tec
- Page 103 and 104:
Dropout/ missing data Method or tec
- Page 105 and 106:
Table 4.1.7 continued Author, year,
- Page 107 and 108:
Table 4.1.7 continued Author, year,
- Page 109 and 110:
Referenser 1. Rocha RO, Ardenghi TM
- Page 111 and 112:
tion compared with conventional rad
- Page 113 and 114:
63. Banerjee A, Watson TF, Kidd EA.
- Page 115 and 116:
93. Rosén B, Birkhed D, Nilsson K,
- Page 117 and 118:
4.2 Röntgendiagnostik Slutsatser G
- Page 119 and 120:
antingen med kabel eller via trådl
- Page 121 and 122:
Risker med röntgenstrålning Rönt
- Page 123 and 124:
När observatörerna skulle bestäm
- Page 125 and 126:
Faktaruta 4.2.2 Nomogrammet som byg
- Page 127 and 128:
Metodik för litteraturgenomgång E
- Page 129 and 130:
procent och specificiteten mellan 9
- Page 131 and 132:
0,1 99 0,2 LR+ LR- 0,5 Visuell insp
- Page 133 and 134:
Intern och extern validitet Diagnos
- Page 135 and 136:
Kommentarer Vilka tänder eller tan
- Page 137 and 138:
för att en tvådimensionell bild a
- Page 139 and 140:
Method Number of teeth and surfaces
- Page 141 and 142:
52 molars and 11 premolars with occ
- Page 143 and 144:
Method Comparison method Outcome me
- Page 145 and 146:
Method Comparison method Outcome me
- Page 147 and 148:
Method Comparison method Outcome me
- Page 149 and 150:
Method Comparison method Outcome me
- Page 151 and 152:
Method Comparison method Outcome me
- Page 153 and 154:
Table 4.2.4 continued Author, year,
- Page 155 and 156:
Table 4.2.4 continued Author, year,
- Page 157 and 158:
Referenser 1. Akdeniz BG, Grondahl
- Page 159 and 160:
33. Espelid I, Tveit AB. A comparis
- Page 161 and 162:
66. Caliskan Yanikoglu F, Östurk F
- Page 163 and 164:
in proximal surfaces versus direct
- Page 165 and 166:
131. Wenzel A, Hintze H. The choice
- Page 167 and 168:
4.3 Tilläggsmetoder för kariesdia
- Page 169 and 170:
kariesskada [81,82]. En diagnostisk
- Page 171 and 172:
(a) (b) (c) (d) (e) Figur 4.3.1 Eff
- Page 173 and 174:
scerar starkt, medan demineralisera
- Page 175 and 176:
förhållandet var tvärtom för pr
- Page 177 and 178:
Tabell 4.3.1 Inklusionskriterier f
- Page 179 and 180:
Dropout/ missing data Comparison me
- Page 181 and 182:
Number of individuals Number of tee
- Page 183 and 184:
Number of individuals Number of tee
- Page 185 and 186:
Dropout/ missing data Method or tec
- Page 187 and 188: Table 4.3.7 continued Author, year,
- Page 189 and 190: Referenser 1. Grossman ES, Cleaton-
- Page 191 and 192: 30. Hall AF, DeSchepper E, Ando M,
- Page 193 and 194: of occlusal caries in children. Car
- Page 195: 4.4. Etiska aspekter Som det framg
- Page 198 and 199: • Salivens flöde och/eller buffr
- Page 200 and 201: för riskfaktorn ifråga innan sjuk
- Page 202 and 203: medel vid beslutsfattande. I slutä
- Page 204 and 205: 55 procent). Karjalainen och medarb
- Page 206 and 207: Kariesskador i primära tänder som
- Page 208 and 209: som hade högst sockerkonsumtion fa
- Page 210 and 211: Övriga inkluderade studier har lå
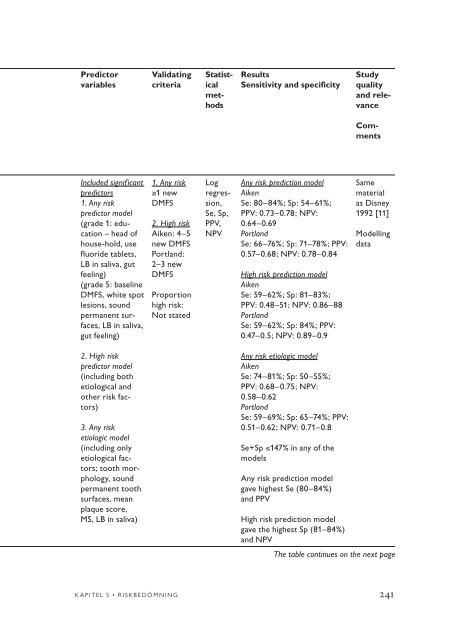
- Page 212 and 213: områdena Aiken och Portland i Nort
- Page 214 and 215: studier visar att låg- och mellanr
- Page 216 and 217: Faktaruta 5.1 Inklusionskriterier f
- Page 218 and 219: Table 5.1 Caries prediction in pre-
- Page 220 and 221: Table 5.1 continued Author Year, re
- Page 222 and 223: Table 5.1 continued Author Year, re
- Page 224 and 225: Table 5.1 continued Author Year, re
- Page 226 and 227: Table 5.1 continued Author Year, re
- Page 228 and 229: Table 5.2 Caries prediction in pre-
- Page 230 and 231: Table 5.2 continued Author Year, re
- Page 232 and 233: Table 5.2 continued Author Year, re
- Page 234 and 235: Table 5.2 continued Author Year, re
- Page 236 and 237: Table 5.3 Caries prediction in scho
- Page 240 and 241: Table 5.3 continued Author Year, re
- Page 242 and 243: Table 5.3 continued Author Year, re
- Page 244 and 245: Table 5.3 continued Author Year, re
- Page 246 and 247: Table 5.3 continued Author Year, re
- Page 248 and 249: Table 5.3 continued Author Year, re
- Page 250 and 251: Table 5.4 Caries prediction in scho
- Page 252 and 253: Table 5.4 continued Author Year, re
- Page 254 and 255: Table 5.4 continued Author Year, re
- Page 256 and 257: Table 5.4 continued Author Year, re
- Page 258 and 259: Table 5.4 continued Author Year, re
- Page 260 and 261: Table 5.4 continued Author Year, re
- Page 262 and 263: Table 5.4 continued Author Year, re
- Page 264 and 265: Table 5.4 continued Author Year, re
- Page 266 and 267: Table 5.4 continued Author Year, re
- Page 268 and 269: Table 5.5 Caries prediction in adul
- Page 270 and 271: Table 5.5 continued Author Year, re
- Page 272 and 273: Table 5.5 continued Author Year, re
- Page 274 and 275: Table 5.6 Caries prediction in adul
- Page 276 and 277: Table 5.6 continued Author Year, re
- Page 278 and 279: Table 5.6 continued Author Year, re
- Page 280 and 281: Table 5.6 continued Author Year, re
- Page 282 and 283: Table 5.6 continued Author Year, re
- Page 284 and 285: Table 5.6 continued Author Year, re
- Page 286 and 287: Table 5.6 continued Author Year, re
- Page 288 and 289:
Table 5.6 continued Author Year, re
- Page 290 and 291:
Table 5.7 Tillförlitligheten hos t
- Page 292 and 293:
Table 5.8 Post-eruptive age as risk
- Page 294 and 295:
Table 5.8 continued Author Year, re
- Page 296 and 297:
Table 5.9 Post-eruptive age as risk
- Page 298 and 299:
Table 5.9 continued Author Year, re
- Page 300 and 301:
Table 5.10 Excluded studies. Author
- Page 302 and 303:
Table 5.10 continued Author, year,
- Page 304 and 305:
Table 5.10 continued Author, year,
- Page 306 and 307:
Table 5.10 continued Author, year,
- Page 308 and 309:
19. Karjalainen S, Söderling E, Se
- Page 310 and 311:
social factors and diseases. Int De
- Page 312 and 313:
isk assessment program in an elderl
- Page 314 and 315:
121. Demers M, Brodeur JM, Simard P
- Page 316 and 317:
study. Community Dent Oral Epidemio
- Page 318 and 319:
private practice. Community Dent Or
- Page 320 and 321:
221. Schröder U, Granath L. Dietar
- Page 322 and 323:
groups. Oral Surg Oral Med Oral Pat
- Page 324 and 325:
287. Ravald N, Birkhed D, Hamp SE.
- Page 326 and 327:
En nyss frambruten tand är mer mot
- Page 328 and 329:
Övriga produkter Ozon De syraprodu
- Page 330 and 331:
En studie, som undersökte effekten
- Page 332 and 333:
för få för slutsatser om effekti
- Page 334 and 335:
Table 6.2 Treatment of early corona
- Page 336 and 337:
Table 6.3 Treatment of early corona
- Page 338 and 339:
Table 6.3 continued Author Year, re
- Page 340 and 341:
Table 6.3 continued Author Year, re
- Page 342 and 343:
Table 6.4 Treatment of early root s
- Page 344 and 345:
Table 6.4 continued Author Year, re
- Page 346 and 347:
Table 6.5 Excluded studies. Author,
- Page 348 and 349:
Referenser 1. Abernathy JR, Graves
- Page 350 and 351:
composite resin restorations. Acta
- Page 353 and 354:
7. Ekonomiska aspekter Slutsatser A
- Page 355 and 356:
Kostnaden för visuell-taktil under
- Page 357 and 358:
Faktaruta 7.1 Hur beräknas kostnad
- Page 359 and 360:
7.1 7.1 1 800 Kronor Kronor 1 600 1
- Page 361 and 362:
8. Tänkbara praxisförändringar T
- Page 363:
Referenser 1. Ekstrand K. Faglig vi
- Page 366 and 367:
DFS DFT dft DiFOTI Dikotomisering D
- Page 368 and 369:
Likelihood-kvot Lingual Makroskopis
- Page 370 and 371:
Rotcement Sensitivitet Specificitet
- Page 372 and 373:
Svante Twetman Professor, odontolog
- Page 375 and 376:
Bilaga 1. Sökstrategier Kapitel 4.
- Page 377 and 378:
Kapitel 5 fortsättning NOT Cariost
- Page 379 and 380:
Bilaga 2. Granskningsmallar Diagnos
- Page 381 and 382:
Studier om riskbedömning Första f
- Page 383 and 384:
Studier om behandling av tidiga kar
- Page 385 and 386:
Bilaga 3. Sensitivitet, specificite
- Page 387 and 388:
9 8 8,0 8,0 LR+ emalj LR- emalj LR
- Page 389 and 390:
Sensitivitet och specificitet 2,0 1
- Page 391 and 392:
200 Procent 180 160 140 120 100 80
- Page 393 and 394:
180 160 140 120 100 80 60 40 20 0 8
- Page 395 and 396:
15. Lussi A. Comparison of differen
- Page 397 and 398:
49. Kordic A, Lussi A, Luder HU. Pe
- Page 399 and 400:
Ont i ryggen, ont i nacken (2000),
- Page 401:
Rapporter på engelska Obstructive