nö restmüllanalyse 2005/06 - H81 Department Wasser-Atmosphäre ...
nö restmüllanalyse 2005/06 - H81 Department Wasser-Atmosphäre ...
nö restmüllanalyse 2005/06 - H81 Department Wasser-Atmosphäre ...

Erfolgreiche ePaper selbst erstellen
Machen Sie aus Ihren PDF Publikationen ein blätterbares Flipbook mit unserer einzigartigen Google optimierten e-Paper Software.
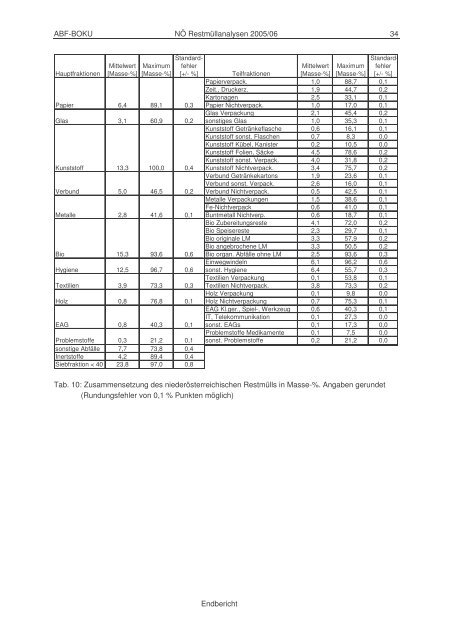
ABF-BOKU NÖ Restmüllanalysen <strong>2005</strong>/<strong>06</strong> 34<br />
Standardfehler<br />
[+/- %] Teilfraktionen<br />
Endbericht<br />
Standardfehler<br />
[+/- %]<br />
Mittelwert Maximum<br />
Mittelwert Maximum<br />
Hauptfraktionen [Masse-%] [Masse-%]<br />
[Masse-%] [Masse-%]<br />
Papierverpack. 1,0 88,7 0,1<br />
Zeit., Druckerz. 1,9 44,7 0,2<br />
Kartonagen 2,5 33,1 0,1<br />
Papier 6,4 89,1 0,3 Papier Nichtverpack. 1,0 17,0 0,1<br />
Glas Verpackung 2,1 45,4 0,2<br />
Glas 3,1 60,9 0,2 sonstiges Glas 1,0 35,3 0,1<br />
Kunststoff Getränkeflasche 0,6 16,1 0,1<br />
Kunststoff sonst. Flaschen 0,7 8,3 0,0<br />
Kunststoff Kübel, Kanister 0,2 10,5 0,0<br />
Kunststoff Folien, Säcke 4,5 78,6 0,2<br />
Kunststoff sonst. Verpack. 4,0 31,8 0,2<br />
Kunststoff 13,3 100,0 0,4 Kunststoff Nichtverpack. 3,4 75,7 0,2<br />
Verbund Getränkekartons 1,9 23,6 0,1<br />
Verbund sonst. Verpack. 2,6 16,0 0,1<br />
Verbund 5,0 46,5 0,2 Verbund Nichtverpack. 0,5 42,5 0,1<br />
Metalle Verpackungen 1,5 38,6 0,1<br />
Fe-Nichtverpack 0,6 41,0 0,1<br />
Metalle 2,8 41,6 0,1 Buntmetall Nichtverp. 0,6 18,7 0,1<br />
Bio Zubereitungsreste 4,1 72,0 0,2<br />
Bio Speisereste 2,3 29,7 0,1<br />
Bio originale LM 3,3 57,9 0,2<br />
Bio angebrochene LM 3,3 50,5 0,2<br />
Bio 15,3 93,6 0,6 Bio organ. Abfälle ohne LM 2,5 93,6 0,3<br />
Einwegwindeln 6,1 96,2 0,6<br />
Hygiene 12,5 96,7 0,6 sonst. Hygiene 6,4 55,7 0,3<br />
Textilien Verpackung 0,1 53,8 0,1<br />
Textilien 3,9 73,3 0,3 Textilien Nichtverpack. 3,8 73,3 0,2<br />
Holz Verpackung 0,1 9,8 0,0<br />
Holz 0,8 76,8 0,1 Holz Nichtverpackung 0,7 75,3 0,1<br />
EAG Kl.ger., Spiel-, Werkzeug 0,6 40,3 0,1<br />
IT, Telekommunikation 0,1 27,3 0,0<br />
EAG 0,8 40,3 0,1 sonst. EAGs 0,1 17,3 0,0<br />
Problemstoffe Medikamente 0,1 7,5 0,0<br />
Problemstoffe 0,3 21,2 0,1 sonst. Problemstoffe 0,2 21,2 0,0<br />
sonstige Abfälle 7,7 73,8 0,4<br />
Inertstoffe 4,2 89,4 0,4<br />
Siebfraktion < 40 mm 23,8 97,0 0,8<br />
Tab. 10: Zusammensetzung des niederösterreichischen Restmülls in Masse-%. Angaben gerundet<br />
(Rundungsfehler von 0,1 % Punkten möglich)