

Outdoor Lighting and Crime - Amper
Outdoor Lighting and Crime - Amper
Outdoor Lighting and Crime - Amper

You also want an ePaper? Increase the reach of your titles
YUMPU automatically turns print PDFs into web optimized ePapers that Google loves.
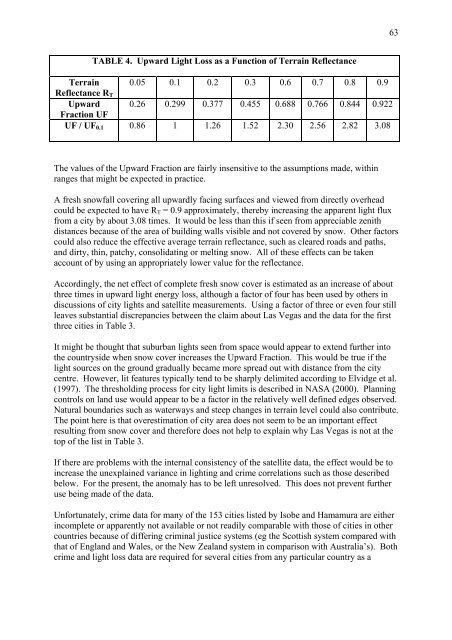
Terrain<br />
Reflectance RT<br />
Upward<br />
Fraction UF<br />
UF / UF0.1<br />
TABLE 4. Upward Light Loss as a Function of Terrain Reflectance<br />
0.05 0.1 0.2 0.3 0.6 0.7 0.8 0.9<br />
0.26 0.299 0.377 0.455 0.688 0.766 0.844 0.922<br />
0.86 1 1.26 1.52 2.30 2.56 2.82 3.08<br />
The values of the Upward Fraction are fairly insensitive to the assumptions made, within<br />
ranges that might be expected in practice.<br />
A fresh snowfall covering all upwardly facing surfaces <strong>and</strong> viewed from directly overhead<br />
could be expected to have RT = 0.9 approximately, thereby increasing the apparent light flux<br />
from a city by about 3.08 times. It would be less than this if seen from appreciable zenith<br />
distances because of the area of building walls visible <strong>and</strong> not covered by snow. Other factors<br />
could also reduce the effective average terrain reflectance, such as cleared roads <strong>and</strong> paths,<br />
<strong>and</strong> dirty, thin, patchy, consolidating or melting snow. All of these effects can be taken<br />
account of by using an appropriately lower value for the reflectance.<br />
Accordingly, the net effect of complete fresh snow cover is estimated as an increase of about<br />
three times in upward light energy loss, although a factor of four has been used by others in<br />
discussions of city lights <strong>and</strong> satellite measurements. Using a factor of three or even four still<br />
leaves substantial discrepancies between the claim about Las Vegas <strong>and</strong> the data for the first<br />
three cities in Table 3.<br />
It might be thought that suburban lights seen from space would appear to extend further into<br />
the countryside when snow cover increases the Upward Fraction. This would be true if the<br />
light sources on the ground gradually became more spread out with distance from the city<br />
centre. However, lit features typically tend to be sharply delimited according to Elvidge et al.<br />
(1997). The thresholding process for city light limits is described in NASA (2000). Planning<br />
controls on l<strong>and</strong> use would appear to be a factor in the relatively well defined edges observed.<br />
Natural boundaries such as waterways <strong>and</strong> steep changes in terrain level could also contribute.<br />
The point here is that overestimation of city area does not seem to be an important effect<br />
resulting from snow cover <strong>and</strong> therefore does not help to explain why Las Vegas is not at the<br />
top of the list in Table 3.<br />
If there are problems with the internal consistency of the satellite data, the effect would be to<br />
increase the unexplained variance in lighting <strong>and</strong> crime correlations such as those described<br />
below. For the present, the anomaly has to be left unresolved. This does not prevent further<br />
use being made of the data.<br />
Unfortunately, crime data for many of the 153 cities listed by Isobe <strong>and</strong> Hamamura are either<br />
incomplete or apparently not available or not readily comparable with those of cities in other<br />
countries because of differing criminal justice systems (eg the Scottish system compared with<br />
that of Engl<strong>and</strong> <strong>and</strong> Wales, or the New Zeal<strong>and</strong> system in comparison with Australia’s). Both<br />
crime <strong>and</strong> light loss data are required for several cities from any particular country as a<br />
63


