

Outdoor Lighting and Crime - Amper
Outdoor Lighting and Crime - Amper
Outdoor Lighting and Crime - Amper

Create successful ePaper yourself
Turn your PDF publications into a flip-book with our unique Google optimized e-Paper software.
Country<br />
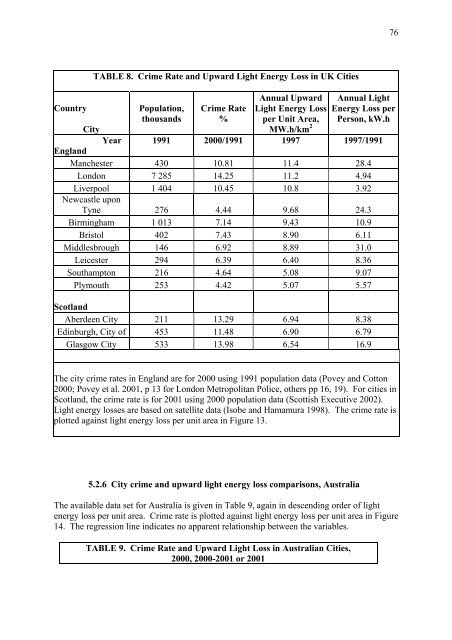
TABLE 8. <strong>Crime</strong> Rate <strong>and</strong> Upward Light Energy Loss in UK Cities<br />
Population,<br />
thous<strong>and</strong>s<br />
<strong>Crime</strong> Rate<br />
%<br />
Annual Upward<br />
Light Energy Loss<br />
per Unit Area,<br />
MW.h/km 2<br />
76<br />
Annual Light<br />
Energy Loss per<br />
Person, kW.h<br />
City<br />
Year<br />
Engl<strong>and</strong><br />
1991 2000/1991 1997<br />
Manchester 430 10.81 11.4 28.4<br />
London 7 285 14.25 11.2 4.94<br />
Liverpool<br />
Newcastle upon<br />
1 404 10.45 10.8 3.92<br />
Tyne 276 4.44 9.68 24.3<br />
Birmingham 1 013 7.14 9.43 10.9<br />
Bristol 402 7.43 8.90 6.11<br />
Middlesbrough 146 6.92 8.89 31.0<br />
Leicester 294 6.39 6.40 8.36<br />
Southampton 216 4.64 5.08 9.07<br />
Plymouth 253 4.42 5.07 5.57<br />
1997/1991<br />
Scotl<strong>and</strong><br />
Aberdeen City 211 13.29 6.94 8.38<br />
Edinburgh, City of 453 11.48 6.90 6.79<br />
Glasgow City 533 13.98 6.54 16.9<br />
The city crime rates in Engl<strong>and</strong> are for 2000 using 1991 population data (Povey <strong>and</strong> Cotton<br />
2000; Povey et al. 2001, p 13 for London Metropolitan Police, others pp 16, 19). For cities in<br />
Scotl<strong>and</strong>, the crime rate is for 2001 using 2000 population data (Scottish Executive 2002).<br />
Light energy losses are based on satellite data (Isobe <strong>and</strong> Hamamura 1998). The crime rate is<br />
plotted against light energy loss per unit area in Figure 13.<br />
5.2.6 City crime <strong>and</strong> upward light energy loss comparisons, Australia<br />
The available data set for Australia is given in Table 9, again in descending order of light<br />
energy loss per unit area. <strong>Crime</strong> rate is plotted against light energy loss per unit area in Figure<br />
14. The regression line indicates no apparent relationship between the variables.<br />
TABLE 9. <strong>Crime</strong> Rate <strong>and</strong> Upward Light Loss in Australian Cities,<br />
2000, 2000-2001 or 2001


