- Page 1 and 2:
Industrial Relations in Europe 2012
- Page 3 and 4:
Neither the European Commission nor
- Page 6:
Table of contents Executive summary
- Page 9 and 10:
employers. The second covers countr
- Page 11 and 12:
as has trade union fragmentation, d
- Page 13 and 14:
collective bargaining, in other cou
- Page 15 and 16:
fragmentation and pay dispersion ha
- Page 17 and 18:
Generating new jobs and transformin
- Page 19 and 20:
een negligible. Second- and third-t
- Page 21 and 22:
Nevertheless, the study indicated m
- Page 24 and 25:
Chapter 1: Overview of European, na
- Page 26 and 27:
2010, collective bargaining coverag
- Page 28 and 29:
short period of eight years. In Est
- Page 30 and 31:
Chart 1.6: Bargaining centralisatio
- Page 32 and 33:
A core aim of the CAWIE project has
- Page 34 and 35:
purposes of the present analysis. T
- Page 36 and 37:
have been substituted by contractin
- Page 38 and 39:
Table 1.1 shows that in 11 countrie
- Page 40 and 41:
SI SK UK Central level agreements.
- Page 42 and 43:
IT LV LT LU MT NL PL PT RO SE SI SK
- Page 44 and 45:
Across the EU the magnitude of the
- Page 46 and 47:
IE IT LV LT LU MT NL PL PT RO SE Jo
- Page 48 and 49:
argaining in the same way so that d
- Page 50 and 51:
Table 1.6: Major unions in the publ
- Page 52 and 53:
LU LV MT NL General Confederation o
- Page 54 and 55:
As shown by Visser (2010) for the n
- Page 56 and 57:
1.5 Employers’ associations In co
- Page 58 and 59:
SI SK Governmental bargaining group
- Page 60 and 61:
State-centred, including Greece, Sp
- Page 62 and 63:
Chart 1.12: Comparison between nati
- Page 64 and 65:
this would imply that industrial re
- Page 66 and 67:
Doellgast, V. and Greer, I. (2007),
- Page 68 and 69:
Chapter 2: Industrial relations dev
- Page 70 and 71:
the only available source of compar
- Page 72 and 73:
Chart 2.4: Annual net earnings in t
- Page 74 and 75:
Table 2.1 GINI coefficients for the
- Page 76 and 77:
producers’ Finally, the governmen
- Page 78 and 79:
A weakening membership base indicat
- Page 80 and 81:
less eager to join an employers’
- Page 82 and 83:
The lower degree of bargaining coor
- Page 84 and 85:
Existence of tripartite council con
- Page 86 and 87:
including trade unions in policymak
- Page 88 and 89:
Legal extension of collective agree
- Page 90 and 91:
Descriptive statistical evidence (s
- Page 92 and 93:
of sector-level collective agreemen
- Page 94 and 95:
* Italics indicate pacts addressing
- Page 96 and 97:
the liberal CEECs (LT, LV, EE, RO a
- Page 98 and 99:
2.3.7 Interim conclusions Unionisat
- Page 100 and 101:
Chart 2.16: Multi-national companie
- Page 102 and 103:
Box 2.3 Coping with the economic cr
- Page 104 and 105:
motivation for employers was findin
- Page 106 and 107:
EE HU rapid increase before the cri
- Page 108 and 109:
SK 2011: cuts/freeze planned SI 200
- Page 110 and 111:
cooperation within the EU, where be
- Page 112 and 113:
cabinet resignation, Romania renege
- Page 114 and 115:
important for building additional r
- Page 116 and 117:
References Avdagic, S. (2005), ‘S
- Page 118: egulationin Eastern Europe’, in D
- Page 121 and 122: and not an exact measurement of the
- Page 123 and 124: Of the remaining countries, four -
- Page 125 and 126: In some cases this is linked to emp
- Page 127 and 128: and social security activities have
- Page 129 and 130: Table 3.4 Part-time employment, 201
- Page 131 and 132: Table 3.6 Number employed in tempor
- Page 133 and 134: 3.4 Employment status and the right
- Page 135 and 136: employees (Angestellte and Arbeiter
- Page 137 and 138: Table 3.8 Trade union density in th
- Page 139 and 140: distinguish between ‘technical’
- Page 141 and 142: with adequate services as well as t
- Page 143 and 144: Wales) about pay increases, based o
- Page 145 and 146: majority public ownership) than in
- Page 147 and 148: 3.7 Centralisation, decentralisatio
- Page 149 and 150: government over the entire bargaini
- Page 151 and 152: 3.8 Industrial conflict and settlem
- Page 153 and 154: all of public employees. Career civ
- Page 155 and 156: is also paid to equal pay and low-p
- Page 157 and 158: Casale G. (2008), Public service la
- Page 159 and 160: Pedersini R. (2009), “La riforma
- Page 161 and 162: Appendix 3.1 Number employed in pub
- Page 164 and 165: Chapter 4: The consequences of the
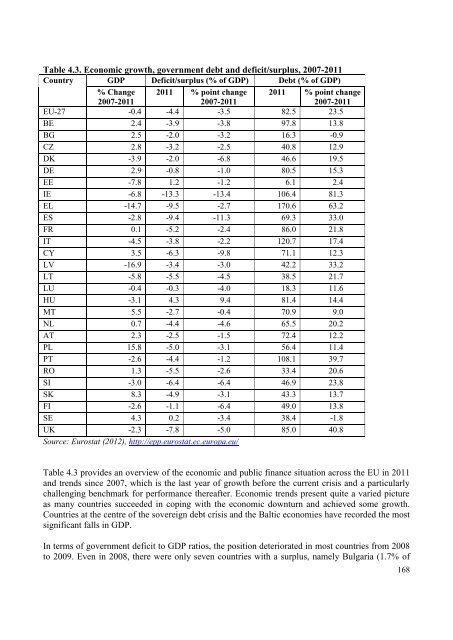
- Page 166 and 167: had a lengthy engagement with NPM r
- Page 170 and 171: GDP), Denmark (3.2%), Cyprus (0.9%)
- Page 172 and 173: in 2009 - a target that was missed
- Page 174 and 175: public sector and its workforce in
- Page 176 and 177: Pay Cut Pay Freeze Other measures H
- Page 178 and 179: Nevertheless, it should be remember
- Page 180 and 181: able to progress to higher salary p
- Page 182 and 183: the sharing of information technolo
- Page 184 and 185: and moves towards fiscal consolidat
- Page 186 and 187: the importance of inward investment
- Page 188 and 189: In countries less affected by auste
- Page 190 and 191: Spain -18,000 in 2010 in public adm
- Page 192 and 193: 4.5.2 Responses of social partners
- Page 194 and 195: Country Protest & Strikes Finland F
- Page 196 and 197: Country Protest & Strikes Spain Ext
- Page 198 and 199: It has been suggested that although
- Page 200 and 201: Acknowledgements We thank Berndt Ke
- Page 202 and 203: Ibsen, C., Larsen, T., Madsen, J. a
- Page 204 and 205: Chapter 5: Greening the social dial
- Page 206 and 207: (Ueapme 2010 55 ). Fostering the ad
- Page 208 and 209: 5.3 Cooperative approaches in manag
- Page 210 and 211: Chemical industry institutes) is th
- Page 212 and 213: 5.4 Representation within an emergi
- Page 214 and 215: In other countries, the emergence o
- Page 216 and 217: Skills developments Career and empl
- Page 218 and 219:
(WiRES 83 ) looked into the aspect
- Page 220 and 221:
Career and employment security Heal
- Page 222 and 223:
solar energy production, has launch
- Page 224 and 225:
will hire unemployed workers, with
- Page 226 and 227:
Overall, industrial relations in gr
- Page 228 and 229:
References Arbeiterkammer Wien, Ins
- Page 230 and 231:
Chapter 6: Social partner involveme
- Page 232 and 233:
the same country in different areas
- Page 234 and 235:
6.3 Unemployment benefit systems Th
- Page 236 and 237:
established tripartite cooperation.
- Page 238 and 239:
would appear that the funds were a
- Page 240 and 241:
Further, according to the most rece
- Page 242 and 243:
An example of social concertation i
- Page 244 and 245:
government will facilitate the acco
- Page 246 and 247:
funds. The schemes were based on pe
- Page 248 and 249:
of industrial actions in the summer
- Page 250 and 251:
managing these insurance funds is t
- Page 252 and 253:
6.6.2 Social partner influence on p
- Page 254 and 255:
etirement income gap by private fun
- Page 256 and 257:
Acknowledgements The author would l
- Page 258:
Natali D (2009), Public/private mix
- Page 261 and 262:
Commission must consult the social
- Page 263 and 264:
social partners' increasing role as
- Page 265 and 266:
The agreement is a significant achi
- Page 267 and 268:
the Commission not to present it to
- Page 269 and 270:
In late July 2012 the cross-industr
- Page 271 and 272:
Through the AGS the Commission has
- Page 273 and 274:
workplaces in local and regional go
- Page 275 and 276:
Moreover, the social partners are c
- Page 277 and 278:
Change Summit in Cancun in December
- Page 279 and 280:
linked to the Europe 2020 strategy
- Page 281 and 282:
EU's flagship policy towards the se
- Page 283 and 284:
to be included in the national LLL
- Page 285 and 286:
industry and sectoral social dialog
- Page 287 and 288:
In the construction sector, the Eur
- Page 289 and 290:
In the sugar sector, the implementa
- Page 291 and 292:
Directive on 30 May 2012. In this,
- Page 293 and 294:
well represented at the higher leve
- Page 295 and 296:
to establish and/or improve nationa
- Page 297 and 298:
Federation of Textiles, Clothing an
- Page 299 and 300:
Chart 7.1 Number and type of texts
- Page 301 and 302:
commitment to the aim of full imple
- Page 303 and 304:
Table 7.1: European sectoral social
- Page 305 and 306:
Table 7.2: European social partner
- Page 307 and 308:
Recovering and strengthening compet
- Page 309 and 310:
Joint position regarding the Europe
- Page 311 and 312:
developments, explains the Commissi
- Page 313 and 314:
The review is based on consultation
- Page 315 and 316:
concluded on 21 May 2012 a European
- Page 317 and 318:
Furthermore, studies were commissio
- Page 319 and 320:
Report of 26 October 2012 on the im
- Page 321 and 322:
Six judgments were delivered relati
- Page 323 and 324:
In Case C-3/10 162 , the ECJ ruled
- Page 325 and 326:
In Case C 282/10 179 , the ECJ deci
- Page 327 and 328:
8.3 Health and safety of workers 8.
- Page 329 and 330:
8.3.5 Exposure to asbestos Practica
- Page 331 and 332:
of data due to the need for major a
- Page 333 and 334:
and effects of the EU Directives on
- Page 335 and 336:
2. FREE MOVEMENT OF WORKERS DIRECTI
- Page 337 and 338:
HOW TO OBTAIN EU PUBLICATIONS Free