beyond pt 0 23/1
beyond pt 0 23/1
beyond pt 0 23/1

Create successful ePaper yourself
Turn your PDF publications into a flip-book with our unique Google optimized e-Paper software.
Section Three<br />
Information Technology (IT) industries and<br />
e-commerce<br />
Computing power has been<br />
doubling every 18 months for<br />
the past 30 years. At the same<br />
time, the average price of a<br />
transistor has fallen by six<br />
orders of magnitude, due to<br />
microprocessor development.<br />
In just six years (1991 to<br />
1997), the cost of<br />
microprocessor computing<br />
power decreased from $<strong>23</strong>0<br />
to $3.42 per MIPS. No other<br />
manufactured item has<br />
decreased in cost so far,<br />
so fast.<br />
Henry D, Cooke S, Montes, 1998,<br />
The Emerging Digital Economy,<br />
US Department of Commerce 1998<br />
The IT industries are relatively new and dynamic in nature. The<br />
IT industries have a number of unusual characteristics. They are<br />
among the fastest growing industries. Technological change is rapid<br />
and product life cycles are short. Most product and service prices are<br />
falling rather than rising. Convergence in the industries is leading to<br />
the increasing inter-relation and interdependence of computing,<br />
communications and the media. This is also profoundly changing the<br />
structure and dynamics of the IT industries. 12 Change in the<br />
IT industries and their capacity is driving change in the use of<br />
e-commerce while the IT industries are also being driven by changes in<br />
e-commerce usage.<br />
3.1 The IT industries<br />
Data reported in the report Spectator or Serious Player? indicated that<br />
Australia’s information industries generated $66–69 billion of market<br />
revenues in 1995. That is some 7.5 per cent of turnover in the<br />
Australian economy.<br />
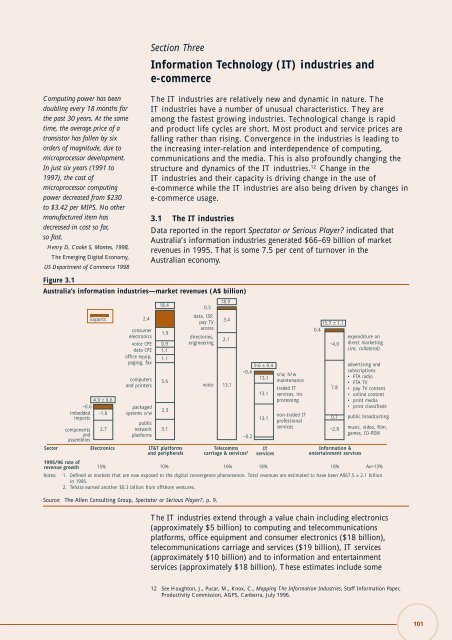
Figure 3.1<br />
Australia’s information industries—market revenues (A$ billion)<br />
Notes:<br />
4.9 ± 0.6<br />
~0.6<br />
imbedded -1.6<br />
imports<br />
components<br />
and<br />
assemblies<br />
Exports<br />
2.7<br />
public<br />
network<br />
platforms<br />
18.4<br />
voice<br />
Source: The Allen Consulting Group, Spectator or Serious Player?, p. 9.<br />
2.4<br />
consumer<br />
electronics<br />
voice CPE<br />
data CPE<br />
office equip,<br />
paging, fax<br />
computers<br />
and printers<br />
packaged<br />
systems s/w<br />
1.9<br />
0.9<br />
1.1<br />
1.1<br />
Sector Electronics IT&T platforms<br />
and peripherals<br />
5.6<br />
2.3<br />
3.1<br />
0.3<br />
data, ISP,<br />
pay TV<br />
access<br />
directories,<br />
engineering<br />
18.9<br />
3.4<br />
2.1<br />
13.1<br />
9.6 ± 0.4<br />
~0.4<br />
13.1<br />
~0.2<br />
Telecomms<br />
carriage & services 2<br />
13.1<br />
13.1<br />
IT<br />
services<br />
s/w, h/w<br />
maintenance<br />
traded IT<br />
services, inc<br />
processing<br />
non-traded IT<br />
professional<br />
services<br />
15.7 ± 1.1<br />
0.4<br />
1. Defined as markets that are now exposed to the digital convergence phenomenon. Total revenues are estimated to have been A$67.5 ± 2.1 billion<br />
in 1995.<br />
2. Telstra earned another $0.3 billion from offshore ventures.<br />
The IT industries extend through a value chain including electronics<br />
(approximately $5 billion) to computing and telecommunications<br />
platforms, office equipment and consumer electronics ($18 billion),<br />
telecommunications carriage and services ($19 billion), IT services<br />
(approximately $10 billion) and to information and entertainment<br />
services (approximately $18 billion). These estimates include some<br />
~4.0<br />
7.8<br />
0.7<br />
~2.8<br />
Information &<br />
entertainment services<br />
expenditure on<br />
direct marketing<br />
(inc. collateral)<br />
advertising and<br />
subscri<strong>pt</strong>ions<br />
• FTA radio<br />
• FTA TV<br />
• pay TV content<br />
• online content<br />
• print media<br />
• print classifieds<br />
public broadcasting<br />
music, video, film,<br />
games, CD-ROM<br />
1995/96 rate of<br />
revenue growth 15% 10% 16% 18% 10% Av=13%<br />
12 See Houghton, J., Pucar, M., Knox, C., Mapping The Information Industries, Staff Information Paper,<br />
Productivity Commission, AGPS, Canberra, July 1996.<br />
101