beyond pt 0 23/1
beyond pt 0 23/1
beyond pt 0 23/1

You also want an ePaper? Increase the reach of your titles
YUMPU automatically turns print PDFs into web optimized ePapers that Google loves.
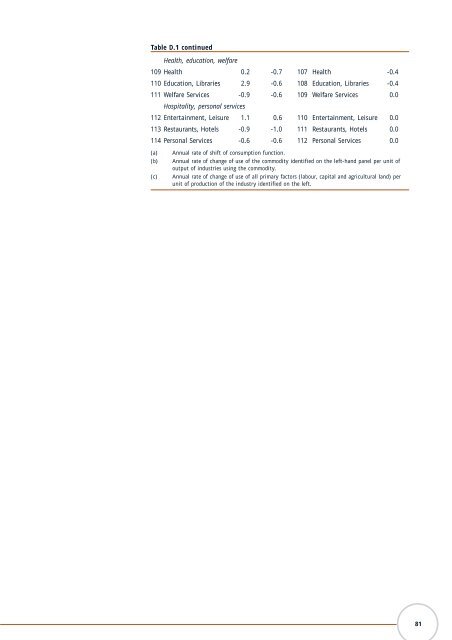
Table D.1 continued<br />
Health, education, welfare<br />
109 Health 0.2 -0.7 107 Health -0.4<br />
110 Education, Libraries 2.9 -0.6 108 Education, Libraries -0.4<br />
111 Welfare Services -0.9 -0.6 109 Welfare Services 0.0<br />
Hospitality, personal services<br />
112 Entertainment, Leisure 1.1 0.6 110 Entertainment, Leisure 0.0<br />
113 Restaurants, Hotels -0.9 -1.0 111 Restaurants, Hotels 0.0<br />
114 Personal Services -0.6 -0.6 112 Personal Services 0.0<br />
(a)<br />
(b)<br />
(c)<br />
Annual rate of shift of consum<strong>pt</strong>ion function.<br />
Annual rate of change of use of the commodity identified on the left-hand panel per unit of<br />
output of industries using the commodity.<br />
Annual rate of change of use of all primary factors (labour, capital and agricultural land) per<br />
unit of production of the industry identified on the left.<br />
81