beyond pt 0 23/1
beyond pt 0 23/1
beyond pt 0 23/1

You also want an ePaper? Increase the reach of your titles
YUMPU automatically turns print PDFs into web optimized ePapers that Google loves.
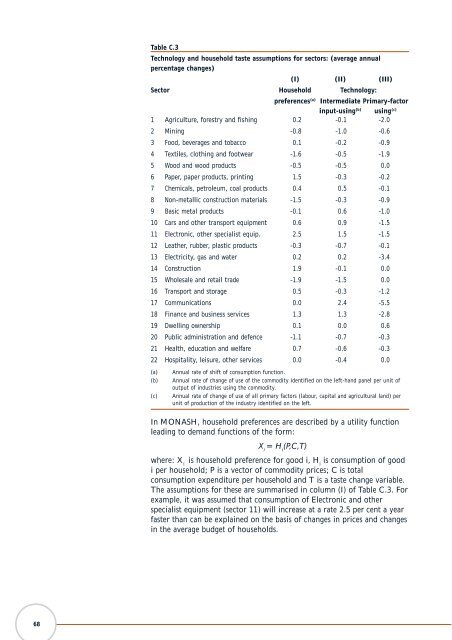
Table C.3<br />
Technology and household taste assum<strong>pt</strong>ions for sectors: (average annual<br />
percentage changes)<br />
(I) (II) (III)<br />
Sector Household Technology:<br />
preferences (a) Intermediate Primary-factor<br />
input-using (b) using (c)<br />
1 Agriculture, forestry and fishing 0.2 -0.1 -2.0<br />
2 Mining -0.8 -1.0 -0.6<br />
3 Food, beverages and tobacco 0.1 -0.2 -0.9<br />
4 Textiles, clothing and footwear -1.6 -0.5 -1.9<br />
5 Wood and wood products -0.5 -0.5 0.0<br />
6 Paper, paper products, printing 1.5 -0.3 -0.2<br />
7 Chemicals, petroleum, coal products 0.4 0.5 -0.1<br />
8 Non-metallic construction materials -1.5 -0.3 -0.9<br />
9 Basic metal products -0.1 0.6 -1.0<br />
10 Cars and other transport equipment 0.6 0.9 -1.5<br />
11 Electronic, other specialist equip. 2.5 1.5 -1.5<br />
12 Leather, rubber, plastic products -0.3 -0.7 -0.1<br />
13 Electricity, gas and water 0.2 0.2 -3.4<br />
14 Construction 1.9 -0.1 0.0<br />
15 Wholesale and retail trade -1.9 -1.5 0.0<br />
16 Transport and storage 0.5 -0.3 -1.2<br />
17 Communications 0.0 2.4 -5.5<br />
18 Finance and business services 1.3 1.3 -2.8<br />
19 Dwelling ownership 0.1 0.0 0.6<br />
20 Public administration and defence -1.1 -0.7 -0.3<br />
21 Health, education and welfare 0.7 -0.6 -0.3<br />
22 Hospitality, leisure, other services 0.0 -0.4 0.0<br />
(a)<br />
(b)<br />
(c)<br />
Annual rate of shift of consum<strong>pt</strong>ion function.<br />
Annual rate of change of use of the commodity identified on the left-hand panel per unit of<br />
output of industries using the commodity.<br />
Annual rate of change of use of all primary factors (labour, capital and agricultural land) per<br />
unit of production of the industry identified on the left.<br />
In MONASH, household preferences are described by a utility function<br />
leading to demand functions of the form:<br />
X i<br />
= H i<br />
(P,C,T)<br />
where: X i<br />
is household preference for good i, H i<br />
is consum<strong>pt</strong>ion of good<br />
i per household; P is a vector of commodity prices; C is total<br />
consum<strong>pt</strong>ion expenditure per household and T is a taste change variable.<br />
The assum<strong>pt</strong>ions for these are summarised in column (I) of Table C.3. For<br />
example, it was assumed that consum<strong>pt</strong>ion of Electronic and other<br />
specialist equipment (sector 11) will increase at a rate 2.5 per cent a year<br />
faster than can be explained on the basis of changes in prices and changes<br />
in the average budget of households.<br />
68