beyond pt 0 23/1
beyond pt 0 23/1
beyond pt 0 23/1

You also want an ePaper? Increase the reach of your titles
YUMPU automatically turns print PDFs into web optimized ePapers that Google loves.
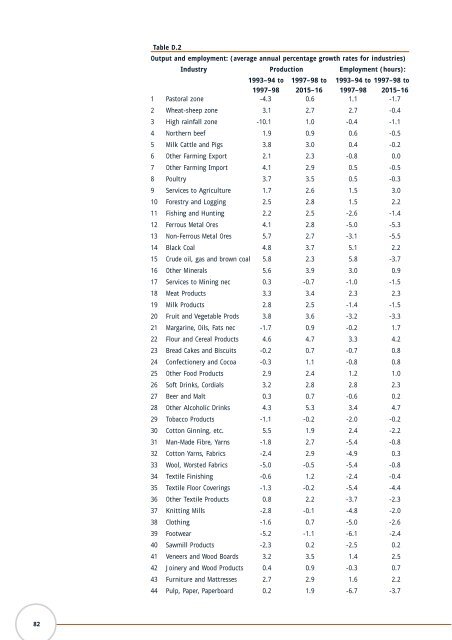
Table D.2<br />
Output and employment: (average annual percentage growth rates for industries)<br />
Industry Production Employment (hours):<br />
1993–94 to 1997–98 to 1993–94 to 1997–98 to<br />
1997–98 2015–16 1997–98 2015–16<br />
1 Pastoral zone -4.3 0.6 1.1 -1.7<br />
2 Wheat-sheep zone 3.1 2.7 2.7 -0.4<br />
3 High rainfall zone -10.1 1.0 -0.4 -1.1<br />
4 Northern beef 1.9 0.9 0.6 -0.5<br />
5 Milk Cattle and Pigs 3.8 3.0 0.4 -0.2<br />
6 Other Farming Export 2.1 2.3 -0.8 0.0<br />
7 Other Farming Import 4.1 2.9 0.5 -0.5<br />
8 Poultry 3.7 3.5 0.5 -0.3<br />
9 Services to Agriculture 1.7 2.6 1.5 3.0<br />
10 Forestry and Logging 2.5 2.8 1.5 2.2<br />
11 Fishing and Hunting 2.2 2.5 -2.6 -1.4<br />
12 Ferrous Metal Ores 4.1 2.8 -5.0 -5.3<br />
13 Non-Ferrous Metal Ores 5.7 2.7 -3.1 -5.5<br />
14 Black Coal 4.8 3.7 5.1 2.2<br />
15 Crude oil, gas and brown coal 5.8 2.3 5.8 -3.7<br />
16 Other Minerals 5.6 3.9 3.0 0.9<br />
17 Services to Mining nec 0.3 -0.7 -1.0 -1.5<br />
18 Meat Products 3.3 3.4 2.3 2.3<br />
19 Milk Products 2.8 2.5 -1.4 -1.5<br />
20 Fruit and Vegetable Prods 3.8 3.6 -3.2 -3.3<br />
21 Margarine, Oils, Fats nec -1.7 0.9 -0.2 1.7<br />
22 Flour and Cereal Products 4.6 4.7 3.3 4.2<br />
<strong>23</strong> Bread Cakes and Biscuits -0.2 0.7 -0.7 0.8<br />
24 Confectionery and Cocoa -0.3 1.1 -0.8 0.8<br />
25 Other Food Products 2.9 2.4 1.2 1.0<br />
26 Soft Drinks, Cordials 3.2 2.8 2.8 2.3<br />
27 Beer and Malt 0.3 0.7 -0.6 0.2<br />
28 Other Alcoholic Drinks 4.3 5.3 3.4 4.7<br />
29 Tobacco Products -1.1 -0.2 -2.0 -0.2<br />
30 Cotton Ginning, etc. 5.5 1.9 2.4 -2.2<br />
31 Man-Made Fibre, Yarns -1.8 2.7 -5.4 -0.8<br />
32 Cotton Yarns, Fabrics -2.4 2.9 -4.9 0.3<br />
33 Wool, Worsted Fabrics -5.0 -0.5 -5.4 -0.8<br />
34 Textile Finishing -0.6 1.2 -2.4 -0.4<br />
35 Textile Floor Coverings -1.3 -0.2 -5.4 -4.4<br />
36 Other Textile Products 0.8 2.2 -3.7 -2.3<br />
37 Knitting Mills -2.8 -0.1 -4.8 -2.0<br />
38 Clothing -1.6 0.7 -5.0 -2.6<br />
39 Footwear -5.2 -1.1 -6.1 -2.4<br />
40 Sawmill Products -2.3 0.2 -2.5 0.2<br />
41 Veneers and Wood Boards 3.2 3.5 1.4 2.5<br />
42 Joinery and Wood Products 0.4 0.9 -0.3 0.7<br />
43 Furniture and Mattresses 2.7 2.9 1.6 2.2<br />
44 Pulp, Paper, Paperboard 0.2 1.9 -6.7 -3.7<br />
82