beyond pt 0 23/1
beyond pt 0 23/1
beyond pt 0 23/1

Create successful ePaper yourself
Turn your PDF publications into a flip-book with our unique Google optimized e-Paper software.
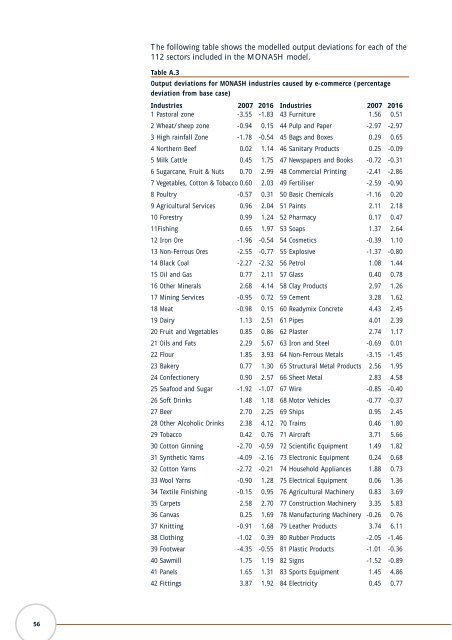
The following table shows the modelled output deviations for each of the<br />
112 sectors included in the MONASH model.<br />
Table A.3<br />
Output deviations for MONASH industries caused by e-commerce (percentage<br />
deviation from base case)<br />
Industries 2007 2016<br />
1 Pastoral zone -3.55 -1.83<br />
2 Wheat/sheep zone -0.94 0.15<br />
3 High rainfall Zone -1.78 -0.54<br />
4 Northern Beef 0.02 1.14<br />
5 Milk Cattle 0.45 1.75<br />
6 Sugarcane, Fruit & Nuts 0.70 2.99<br />
7 Vegetables, Cotton & Tobacco 0.60 2.03<br />
8 Poultry -0.57 0.31<br />
9 Agricultural Services 0.96 2.04<br />
10 Forestry 0.99 1.24<br />
11Fishing 0.65 1.97<br />
12 Iron Ore -1.96 -0.54<br />
13 Non-Ferrous Ores -2.55 -0.77<br />
14 Black Coal -2.27 -2.32<br />
15 Oil and Gas 0.77 2.11<br />
16 Other Minerals 2.68 4.14<br />
17 Mining Services -0.95 0.72<br />
18 Meat -0.98 0.15<br />
19 Dairy 1.13 2.51<br />
20 Fruit and Vegetables 0.85 0.86<br />
21 Oils and Fats 2.29 5.67<br />
22 Flour 1.85 3.93<br />
<strong>23</strong> Bakery 0.77 1.30<br />
24 Confectionery 0.90 2.57<br />
25 Seafood and Sugar -1.92 -1.07<br />
26 Soft Drinks 1.48 1.18<br />
27 Beer 2.70 2.25<br />
28 Other Alcoholic Drinks 2.38 4.12<br />
29 Tobacco 0.42 0.76<br />
30 Cotton Ginning -2.70 -0.59<br />
31 Synthetic Yarns -4.09 -2.16<br />
32 Cotton Yarns -2.72 -0.21<br />
33 Wool Yarns -0.90 1.28<br />
34 Textile Finishing -0.15 0.95<br />
35 Carpets 2.58 2.70<br />
36 Canvas 0.25 1.69<br />
37 Knitting -0.91 1.68<br />
38 Clothing -1.02 0.39<br />
39 Footwear -4.35 -0.55<br />
40 Sawmill 1.75 1.19<br />
41 Panels 1.65 1.31<br />
42 Fittings 3.87 1.92<br />
Industries 2007 2016<br />
43 Furniture 1.56 0.51<br />
44 Pulp and Paper -2.97 -2.97<br />
45 Bags and Boxes 0.29 0.65<br />
46 Sanitary Products 0.25 -0.09<br />
47 Newspapers and Books -0.72 -0.31<br />
48 Commercial Printing -2.41 -2.86<br />
49 Fertiliser -2.59 -0.90<br />
50 Basic Chemicals -1.16 0.20<br />
51 Paints 2.11 2.18<br />
52 Pharmacy 0.17 0.47<br />
53 Soaps 1.37 2.64<br />
54 Cosmetics -0.39 1.10<br />
55 Explosive -1.37 -0.80<br />
56 Petrol 1.08 1.44<br />
57 Glass 0.40 0.78<br />
58 Clay Products 2.97 1.26<br />
59 Cement 3.28 1.62<br />
60 Readymix Concrete 4.43 2.45<br />
61 Pipes 4.01 2.39<br />
62 Plaster 2.74 1.17<br />
63 Iron and Steel -0.69 0.01<br />
64 Non-Ferrous Metals -3.15 -1.45<br />
65 Structural Metal Products 2.56 1.95<br />
66 Sheet Metal 2.83 4.58<br />
67 Wire -0.85 -0.40<br />
68 Motor Vehicles -0.77 -0.37<br />
69 Ships 0.95 2.45<br />
70 Trains 0.46 1.80<br />
71 Aircraft 3.71 5.66<br />
72 Scientific Equipment 1.49 1.82<br />
73 Electronic Equipment 0.24 0.68<br />
74 Household Appliances 1.88 0.73<br />
75 Electrical Equipment 0.06 1.36<br />
76 Agricultural Machinery 0.83 3.69<br />
77 Construction Machinery 3.35 5.83<br />
78 Manufacturing Machinery -0.26 0.76<br />
79 Leather Products 3.74 6.11<br />
80 Rubber Products -2.05 -1.46<br />
81 Plastic Products -1.01 -0.36<br />
82 Signs -1.52 -0.89<br />
83 Sports Equipment 1.45 4.86<br />
84 Electricity 0.45 0.77<br />
56