beyond pt 0 23/1
beyond pt 0 23/1
beyond pt 0 23/1

You also want an ePaper? Increase the reach of your titles
YUMPU automatically turns print PDFs into web optimized ePapers that Google loves.
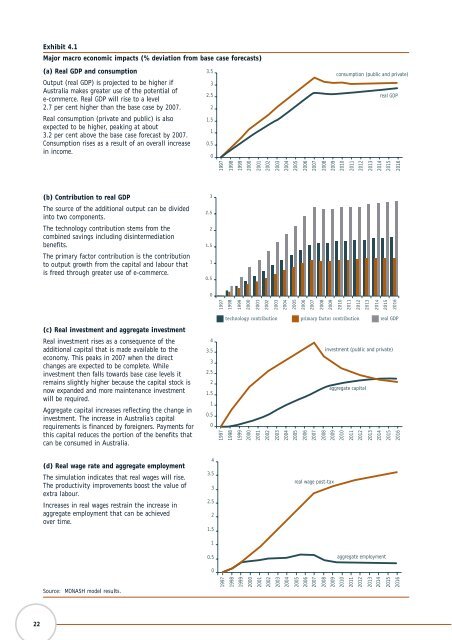
Exhibit 4.1<br />
Major macro economic impacts (% deviation from base case forecasts)<br />
(a) Real GDP and consum<strong>pt</strong>ion<br />
Output (real GDP) is projected to be higher if<br />
Australia makes greater use of the potential of<br />
e-commerce. Real GDP will rise to a level<br />
2.7 per cent higher than the base case by 2007.<br />
Real consum<strong>pt</strong>ion (private and public) is also<br />
expected to be higher, peaking at about<br />
3.2 per cent above the base case forecast by 2007.<br />
Consum<strong>pt</strong>ion rises as a result of an overall increase<br />
in income.<br />
3.5<br />
3<br />
2.5<br />
2<br />
1.5<br />
1<br />
0.5<br />
0<br />
consum<strong>pt</strong>ion (public and private)<br />
real GDP<br />
1997<br />
1998<br />
1999<br />
2000<br />
2001<br />
2002<br />
2003<br />
2004<br />
2005<br />
2006<br />
2007<br />
2008<br />
2009<br />
2010<br />
2011<br />
2012<br />
2013<br />
2014<br />
2015<br />
2016<br />
(b) Contribution to real GDP<br />
The source of the additional output can be divided<br />
into two components.<br />
The technology contribution stems from the<br />
combined savings including disintermediation<br />
benefits.<br />
The primary factor contribution is the contribution<br />
to output growth from the capital and labour that<br />
is freed through greater use of e-commerce.<br />
(c) Real investment and aggregate investment<br />
Real investment rises as a consequence of the<br />
additional capital that is made available to the<br />
economy. This peaks in 2007 when the direct<br />
changes are expected to be complete. While<br />
investment then falls towards base case levels it<br />
remains slightly higher because the capital stock is<br />
now expanded and more maintenance investment<br />
will be required.<br />
Aggregate capital increases reflecting the change in<br />
investment. The increase in Australia’s capital<br />
requirements is financed by foreigners. Payments for<br />
this capital reduces the portion of the benefits that<br />
can be consumed in Australia.<br />
4<br />
3.5<br />
3<br />
2.5<br />
2<br />
1.5<br />
1<br />
0.5<br />
0<br />
1997<br />
1998<br />
1999<br />
2000<br />
2001<br />
2002<br />
2003<br />
2004<br />
2005<br />
2006<br />
2007<br />
investment (public and private)<br />
aggregate capital<br />
2008<br />
2009<br />
2010<br />
2011<br />
2012<br />
2013<br />
2014<br />
2015<br />
2016<br />
(d) Real wage rate and aggregate employment<br />
The simulation indicates that real wages will rise.<br />
The productivity improvements boost the value of<br />
extra labour.<br />
Increases in real wages restrain the increase in<br />
aggregate employment that can be achieved<br />
over time.<br />
4<br />
3.5<br />
3<br />
2.5<br />
2<br />
1.5<br />
1<br />
real wage post-tax<br />
0.5<br />
aggregate employment<br />
0<br />
Source: MONASH model results.<br />
1997<br />
1998<br />
1999<br />
2000<br />
2001<br />
2002<br />
2003<br />
2004<br />
2005<br />
2006<br />
2007<br />
2008<br />
2009<br />
2010<br />
2011<br />
2012<br />
2013<br />
2014<br />
2015<br />
2016<br />
22