beyond pt 0 23/1
beyond pt 0 23/1
beyond pt 0 23/1

You also want an ePaper? Increase the reach of your titles
YUMPU automatically turns print PDFs into web optimized ePapers that Google loves.
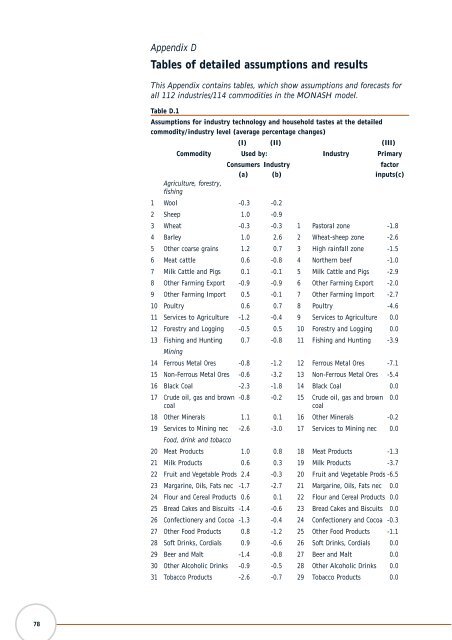
Appendix D<br />
Tables of detailed assum<strong>pt</strong>ions and results<br />
This Appendix contains tables, which show assum<strong>pt</strong>ions and forecasts for<br />
all 112 industries/114 commodities in the MONASH model.<br />
Table D.1<br />
Assum<strong>pt</strong>ions for industry technology and household tastes at the detailed<br />
commodity/industry level (average percentage changes)<br />
(I) (II) (III)<br />
Commodity Used by: Industry Primary<br />
Consumers Industry<br />
factor<br />
(a) (b) inputs(c)<br />
Agriculture, forestry,<br />
fishing<br />
1 Wool -0.3 -0.2<br />
2 Sheep 1.0 -0.9<br />
3 Wheat -0.3 -0.3 1 Pastoral zone -1.8<br />
4 Barley 1.0 2.6 2 Wheat-sheep zone -2.6<br />
5 Other coarse grains 1.2 0.7 3 High rainfall zone -1.5<br />
6 Meat cattle 0.6 -0.8 4 Northern beef -1.0<br />
7 Milk Cattle and Pigs 0.1 -0.1 5 Milk Cattle and Pigs -2.9<br />
8 Other Farming Export -0.9 -0.9 6 Other Farming Export -2.0<br />
9 Other Farming Import 0.5 -0.1 7 Other Farming Import -2.7<br />
10 Poultry 0.6 0.7 8 Poultry -4.6<br />
11 Services to Agriculture -1.2 -0.4 9 Services to Agriculture 0.0<br />
12 Forestry and Logging -0.5 0.5 10 Forestry and Logging 0.0<br />
13 Fishing and Hunting 0.7 -0.8 11 Fishing and Hunting -3.9<br />
Mining<br />
14 Ferrous Metal Ores -0.8 -1.2 12 Ferrous Metal Ores -7.1<br />
15 Non-Ferrous Metal Ores -0.6 -3.2 13 Non-Ferrous Metal Ores -5.4<br />
16 Black Coal -2.3 -1.8 14 Black Coal 0.0<br />
17 Crude oil, gas and brown -0.8 -0.2 15 Crude oil, gas and brown 0.0<br />
coal<br />
coal<br />
18 Other Minerals 1.1 0.1 16 Other Minerals -0.2<br />
19 Services to Mining nec -2.6 -3.0 17 Services to Mining nec 0.0<br />
Food, drink and tobacco<br />
20 Meat Products 1.0 0.8 18 Meat Products -1.3<br />
21 Milk Products 0.6 0.3 19 Milk Products -3.7<br />
22 Fruit and Vegetable Prods 2.4 -0.3 20 Fruit and Vegetable Prods -6.5<br />
<strong>23</strong> Margarine, Oils, Fats nec -1.7 -2.7 21 Margarine, Oils, Fats nec 0.0<br />
24 Flour and Cereal Products 0.6 0.1 22 Flour and Cereal Products 0.0<br />
25 Bread Cakes and Biscuits -1.4 -0.6 <strong>23</strong> Bread Cakes and Biscuits 0.0<br />
26 Confectionery and Cocoa -1.3 -0.4 24 Confectionery and Cocoa -0.3<br />
27 Other Food Products 0.8 -1.2 25 Other Food Products -1.1<br />
28 Soft Drinks, Cordials 0.9 -0.6 26 Soft Drinks, Cordials 0.0<br />
29 Beer and Malt -1.4 -0.8 27 Beer and Malt 0.0<br />
30 Other Alcoholic Drinks -0.9 -0.5 28 Other Alcoholic Drinks 0.0<br />
31 Tobacco Products -2.6 -0.7 29 Tobacco Products 0.0<br />
78