

Segmentation of Stochastic Images using ... - Jacobs University
Segmentation of Stochastic Images using ... - Jacobs University
Segmentation of Stochastic Images using ... - Jacobs University

You also want an ePaper? Increase the reach of your titles
YUMPU automatically turns print PDFs into web optimized ePapers that Google loves.
Chapter 8 <strong>Segmentation</strong> <strong>of</strong> Classical <strong>Images</strong> Using <strong>Stochastic</strong> Parameters<br />
8.3 Gradient-Based <strong>Segmentation</strong> with <strong>Stochastic</strong> Parameter<br />
Gradient-based segmentation via a level set formulation contains one parameter b that controls the<br />
influence <strong>of</strong> the curvature κ. Making this parameter a random variable, we end up with<br />
φ t (t,x,ω) + v(1 − b(ω)κ(t,x,ω))|∇φ(t,x,ω)| = 0 . (8.12)<br />
The stopping function v is v = 1<br />
1+|∇u|<br />
. Additionally to the necessary Galerkin projection in the<br />
numerical scheme for the solution <strong>of</strong> the gradient-based segmentation, we have to project bκ back to<br />
the polynomial chaos. For this, we use the standard methods presented in Section 3.3. The remaining<br />
part <strong>of</strong> the discretization is analog to the discretization <strong>of</strong> the stochastic gradient-based segmentation<br />
with stochastic image.<br />
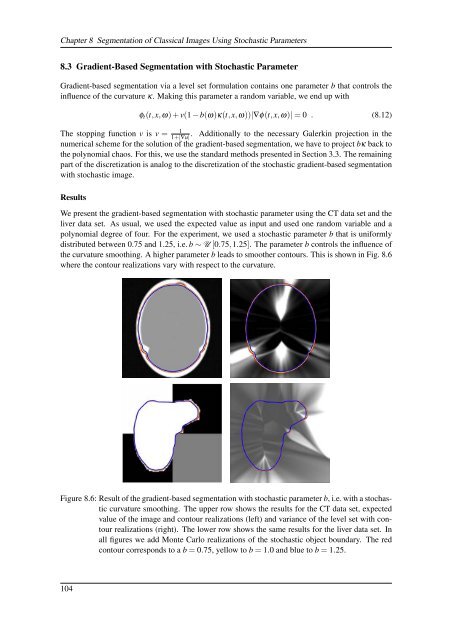
Results<br />
We present the gradient-based segmentation with stochastic parameter <strong>using</strong> the CT data set and the<br />
liver data set. As usual, we used the expected value as input and used one random variable and a<br />
polynomial degree <strong>of</strong> four. For the experiment, we used a stochastic parameter b that is uniformly<br />
distributed between 0.75 and 1.25, i.e. b ∼ U [0.75,1.25]. The parameter b controls the influence <strong>of</strong><br />
the curvature smoothing. A higher parameter b leads to smoother contours. This is shown in Fig. 8.6<br />
where the contour realizations vary with respect to the curvature.<br />
Figure 8.6: Result <strong>of</strong> the gradient-based segmentation with stochastic parameter b, i.e. with a stochastic<br />
curvature smoothing. The upper row shows the results for the CT data set, expected<br />
value <strong>of</strong> the image and contour realizations (left) and variance <strong>of</strong> the level set with contour<br />
realizations (right). The lower row shows the same results for the liver data set. In<br />
all figures we add Monte Carlo realizations <strong>of</strong> the stochastic object boundary. The red<br />
contour corresponds to a b = 0.75, yellow to b = 1.0 and blue to b = 1.25.<br />
104


