

Segmentation of Stochastic Images using ... - Jacobs University
Segmentation of Stochastic Images using ... - Jacobs University
Segmentation of Stochastic Images using ... - Jacobs University

You also want an ePaper? Increase the reach of your titles
YUMPU automatically turns print PDFs into web optimized ePapers that Google loves.
5.4 Visualization <strong>of</strong> <strong>Stochastic</strong> <strong>Images</strong><br />
Figure 5.7: Visualization <strong>of</strong> realizations <strong>of</strong> a stochastic 2D contour. Every yellow line corresponds<br />
to a MC realization <strong>of</strong> the stochastic contour encoded in the stochastic image.<br />
Conclusion<br />
In this chapter, we presented the concept <strong>of</strong> stochastic images and introduced the polynomial chaos<br />
approximation <strong>of</strong> stochastic images. With the projection method from Section 5.2, we are able to construct<br />
stochastic images from samples. This is a crucial task, because without this projection method,<br />
stochastic images are a theoretical construct only, but applications cannot use them. Furthermore,<br />
we presented visualization techniques for stochastic images. The visualization is important to bring<br />
stochastic images into applications. Without an intuitive visualization <strong>of</strong> the additional stochastic<br />
content, it might be difficult to bring the concept <strong>of</strong> stochastic images into applications.<br />
Having the concept <strong>of</strong> stochastic images at hand, we investigate in the next chapters how segmentation<br />
methods can be extended to be able to accept stochastic images as input.<br />
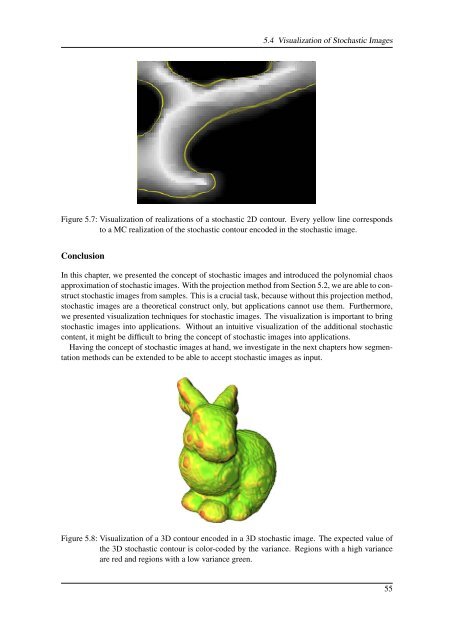
Figure 5.8: Visualization <strong>of</strong> a 3D contour encoded in a 3D stochastic image. The expected value <strong>of</strong><br />
the 3D stochastic contour is color-coded by the variance. Regions with a high variance<br />
are red and regions with a low variance green.<br />
55


