

ESTONIAN ENVIRONMENTAL REVIEW 2009
ESTONIAN ENVIRONMENTAL REVIEW 2009
ESTONIAN ENVIRONMENTAL REVIEW 2009

Create successful ePaper yourself
Turn your PDF publications into a flip-book with our unique Google optimized e-Paper software.
are classified as continuous urban fabric, i.e. if nothing<br />
besides potted plants fit between the buildings, figuratively<br />
speaking. The category of discontinuous urban<br />
fabric includes all of the new residential districts. If we add<br />
to this total the 4.6 km 2 new industrial and commercial<br />
areas (of which 2.2 km 2 are on former agricultural lands<br />
and 1.3 km 2 on forest land) and to a lesser degree other<br />
new built-up areas, we obtain a figure of 23 km 2 of new<br />
built-up areas.<br />
There is a total of 8.2 km 2 of new construction sites, of<br />
which 5.6 km 2 are at the expense of former agricultural<br />
land and 2.6 km 2 of forest land. Where as 6% of the new<br />
residential areas were gained at the expense of forest<br />
land, a total of 30% of the new construction sites are on<br />
former forest land.<br />
New mineral extraction sites have been created<br />
(16 km 2 ), peat extraction areas (12 km 2 ) non-irrigated<br />
arable land (98 km 2 ) (primarily at the expense of pastures,<br />
which may signify an essentially insignificant change).<br />
There has been a loss of 13 km 2 of mineral extraction<br />
sites, 22 km 2 of non-irrigated arable land, 110 km 2 of<br />
pastures and 647 km 2 of forest, including 299 km 2 of it<br />
coniferous, 271 km 2 mixed and 76 km 2 broad-leaved.<br />
These increases and decreases reflect changes in total<br />
area of land cover categories.<br />
Considering the appearance and disappearance of<br />
individual land cover units, we can identify the net balance<br />
for Estonia in the years 2000–2006, in the course of<br />
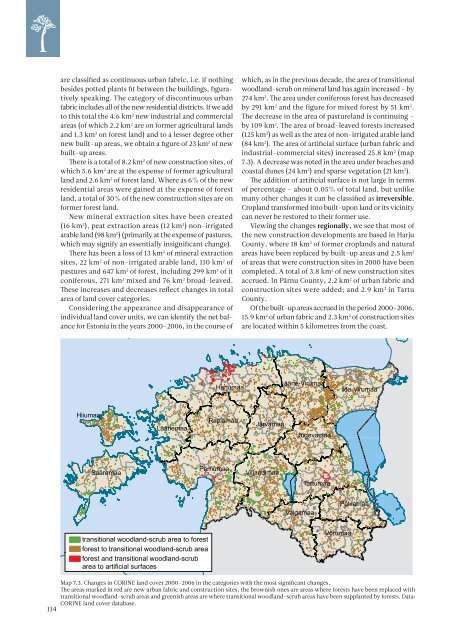
which, as in the previous decade, the area of transitional<br />
woodland-scrub on mineral land has again increased – by<br />
274 km 2 . The area under coniferous forest has decreased<br />
by 291 km 2 and the figure for mixed forest by 51 km 2 .<br />
The decrease in the area of pastureland is continuing –<br />
by 109 km 2 . The area of broad-leaved forests increased<br />
(125 km 2 ) as well as the area of non-irrigated arable land<br />
(84 km 2 ). The area of artificial surface (urban fabric and<br />
industrial-commercial sites) increased 25.8 km 2 (map<br />
7.3). A decrease was noted in the area under beaches and<br />
coastal dunes (24 km 2 ) and sparse vegetation (21 km 2 ).<br />
The addition of artificial surface is not large in terms<br />
of percentage – about 0.05% of total land, but unlike<br />
many other changes it can be classified as irreversible.<br />
Cropland transformed into built-upon land or its vicinity<br />
can never be restored to their former use.<br />
Viewing the changes regionally, we see that most of<br />
the new construction developments are based in Harju<br />
County, where 18 km 2 of former croplands and natural<br />
areas have been replaced by built-up areas and 2.5 km 2<br />
of areas that were construction sites in 2000 have been<br />
completed. A total of 3.8 km 2 of new construction sites<br />
accrued. In Pärnu County, 2.2 km 2 of urban fabric and<br />
construction sites were added; and 2.9 km 2 in Tartu<br />
County.<br />
Of the built-up areas accrued in the period 2000–2006,<br />
15.9 km 2 of urban fabric and 2.3 km 2 of construction sites<br />
are located within 5 kilometres from the coast.<br />
Harjumaa<br />
Lääne-Virumaa<br />
Ida-Virumaa<br />
Hiiumaa<br />
Läänemaa<br />
Raplamaa<br />
Järvamaa<br />
Jõgevamaa<br />
Saaremaa<br />
Pärnumaa<br />
Viljandimaa<br />
Tartumaa<br />
Valgamaa<br />
Põlvamaa<br />
transitional woodland-scrub area to forest<br />
forest to transitional woodland-scrub area<br />
forest and transitional woodland-scrub<br />
area to artificial surfaces<br />
Võrumaa<br />
114<br />
Map 7.3. Changes in CORINE land cover 2000–2006 in the categories with the most significant changes.<br />
The areas marked in red are new urban fabric and construction sites, the brownish ones are areas where forests have been replaced with<br />
transitional woodland-scrub areas and greenish areas are where transitional woodland-scrub areas have been supplanted by forests. Data:<br />
CORINE land cover database.


