

ESTONIAN ENVIRONMENTAL REVIEW 2009
ESTONIAN ENVIRONMENTAL REVIEW 2009
ESTONIAN ENVIRONMENTAL REVIEW 2009

Create successful ePaper yourself
Turn your PDF publications into a flip-book with our unique Google optimized e-Paper software.
300<br />
250<br />
30<br />
agriculture<br />
200<br />
13<br />
manufacturing<br />
human consumption<br />
millions of cubic metres/year<br />
150<br />
100<br />
50<br />
0<br />
125<br />
104<br />
75<br />
99<br />
10<br />
69<br />
92<br />
8<br />
62<br />
88<br />
7<br />
61<br />
87<br />
6<br />
63<br />
76<br />
5<br />
57<br />
61<br />
5<br />
53<br />
53<br />
4<br />
49<br />
49<br />
4<br />
43<br />
46<br />
44 44 4<br />
42 43 4<br />
41 45 4<br />
52 44 4<br />
5<br />
44<br />
42<br />
6<br />
34<br />
44<br />
1992 1993 1994 1995 1996 1997 1998 1999 2000 2001 2002 2003 2004 2005 2006 2007<br />
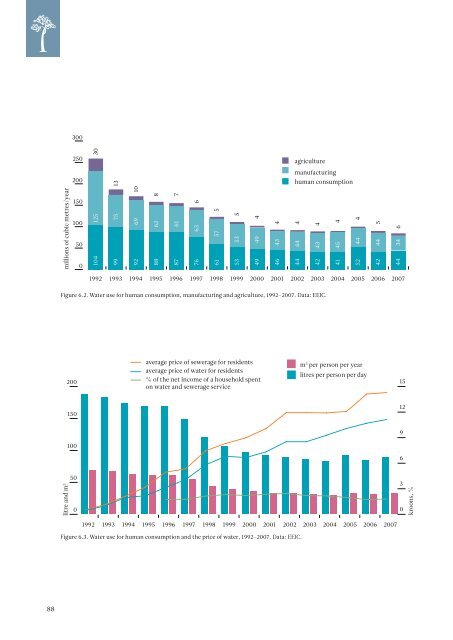
Figure 6.2. Water use for human consumption, manufacturing and agriculture, 1992–2007. Data: EEIC.<br />
200<br />
average price of sewerage for residents<br />
average price of water for residents<br />
% of the net income of a household spent<br />
on water and sewerage service<br />
m 3 per person per year<br />
litres per person per day<br />
15<br />
150<br />
12<br />
9<br />
100<br />
6<br />
litre and m 3<br />
50<br />
0<br />
3<br />
0<br />
kroons, %<br />
1992 1993 1994 1995 1996 1997 1998 1999 2000 2001 2002 2003 2004 2005 2006 2007<br />
Figure 6.3. Water use for human consumption and the price of water, 1992–2007. Data: EEIC.<br />
88


