ESTONIAN ENVIRONMENTAL REVIEW 2009
ESTONIAN ENVIRONMENTAL REVIEW 2009
ESTONIAN ENVIRONMENTAL REVIEW 2009
Create successful ePaper yourself
Turn your PDF publications into a flip-book with our unique Google optimized e-Paper software.
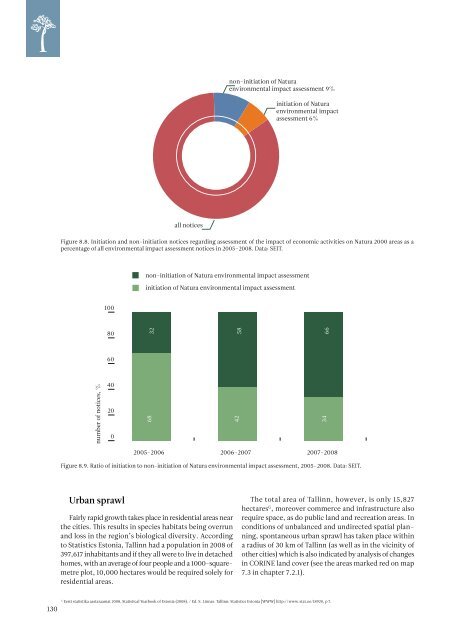
non-initiation of Natura<br />
environmental impact assessment 9%<br />
initiation of Natura<br />
environmental impact<br />
assessment 6%<br />
all notices<br />
Figure 8.8. Initiation and non-initiation notices regarding assessment of the impact of economic activities on Natura 2000 areas as a<br />
percentage of all environmental impact assessment notices 8.8 in 2005–2008. Data: SEIT.<br />
non-initiation of Natura environmental impact assessment<br />
initiation of Natura environmental impact assessment<br />
100<br />
80<br />
32<br />
58<br />
66<br />
60<br />
number of notices, %<br />
40<br />
20<br />
0<br />
68<br />
42<br />
34<br />
2005-2006 2006-2007 2007-2008<br />
Figure 8.9. Ratio of initiation to non-initiation of Natura environmental impact assessment, 2005–2008. Data: SEIT.<br />
Urban sprawl<br />
Fairly rapid growth takes place in residential areas near<br />
the cities. This results in species habitats being overrun<br />
and loss in the region’s biological diversity. According<br />
to Statistics Estonia, Tallinn had a population in 2008 of<br />
397,617 inhabitants and if they all were to live in detached<br />
homes, with an average of four people and a 1000-squaremetre<br />
plot, 10,000 hectares would be required solely for<br />
residential areas.<br />
The total area of Tallinn, however, is only 15,827<br />
hectares G , moreover commerce and infrastructure also<br />
require space, as do public land and recreation areas. In<br />
conditions of unbalanced and undirected spatial planning,<br />
spontaneous urban sprawl has taken place within<br />
a radius of 30 km of Tallinn (as well as in the vicinity of<br />
other cities) which is also indicated by analysis of changes<br />
in CORINE land cover (see the areas marked red on map<br />
7.3 in chapter 7.2.1).<br />
130<br />
G<br />
Eesti statistika aastaraamat 2008. Statistical Yearbook of Estonia (2008). / Ed. S. Linnas. Tallinn: Statistics Estonia [WWW] http://www.stat.ee/18920, p 7.


