

ESTONIAN ENVIRONMENTAL REVIEW 2009
ESTONIAN ENVIRONMENTAL REVIEW 2009
ESTONIAN ENVIRONMENTAL REVIEW 2009

Create successful ePaper yourself
Turn your PDF publications into a flip-book with our unique Google optimized e-Paper software.
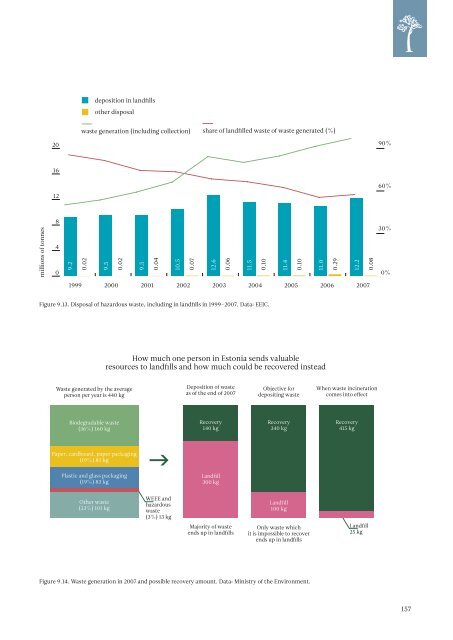
deposition in landfills<br />
other disposal<br />
waste generation (including collection)<br />
share of landfilled waste of waste generated (%)<br />
20<br />
90%<br />
16<br />
60%<br />
12<br />
millions of tonnes<br />
8<br />
4<br />
0<br />
9.2<br />
0.02<br />
9.5<br />
0.02<br />
9.5<br />
0.04<br />
10.5<br />
0.07<br />
12.6<br />
0.06<br />
11.5<br />
0.10<br />
11.4<br />
0.10<br />
11.0<br />
0.29<br />
12.2<br />
0.08<br />
30%<br />
0%<br />
1999<br />
2000<br />
2001 2002 2003 2004<br />
2005 2006<br />
2007<br />
Figure 9.13. Disposal of hazardous waste, including in landfills in 1999–2007. Data: EEIC.<br />
How much one person in Estonia sends valuable<br />
resources to landfills and how much could be recovered instead<br />
Waste generated by the average<br />
person per year is 440 kg<br />
Deposition of waste<br />
as of the end of 2007<br />
Objective for<br />
depositing waste<br />
When waste incineration<br />
comes into effect<br />
Biodegradable waste<br />
(36%) 160 kg<br />
Recovery<br />
140 kg<br />
Recovery<br />
340 kg<br />
Recovery<br />
415 kg<br />
Paper, cardboard, paper packaging<br />
(19%) 83 kg<br />
Plastic and glass packaging<br />
(19%) 83 kg<br />
Landfill<br />
300 kg<br />
Other waste<br />
(23%) 101 kg<br />
WEEE and<br />
hazardous<br />
waste<br />
(3%) 13 kg<br />
Majority of waste<br />
ends up in landfills<br />
Landfill<br />
100 kg<br />
Only waste which<br />
it is impossible to recover<br />
ends up in landfills<br />
Landfill<br />
25 kg<br />
Figure 9.14. Waste generation in 2007 and possible recovery amount. Data: Ministry of the Environment.<br />
157


