

ESTONIAN ENVIRONMENTAL REVIEW 2009
ESTONIAN ENVIRONMENTAL REVIEW 2009
ESTONIAN ENVIRONMENTAL REVIEW 2009

Create successful ePaper yourself
Turn your PDF publications into a flip-book with our unique Google optimized e-Paper software.
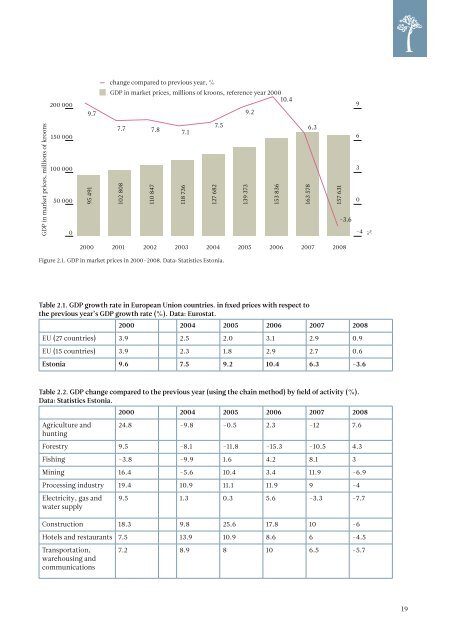
change compared to previous year, %<br />
200 000<br />
9.7<br />
GDP in market prices, millions of kroons, reference year 2000<br />
10.4<br />
9.2<br />
9<br />
GDP in market prices, millions of kroons<br />
150 000<br />
100 000<br />
50 000<br />
0<br />
95 491<br />
7.7 7.8<br />
102 808<br />
110 847<br />
7.1<br />
118 736<br />
127 682<br />
7.5<br />
139 373<br />
153 836<br />
163 578<br />
6.3<br />
157 631<br />
-3.6<br />
6<br />
3<br />
0<br />
-4<br />
%<br />
2000 2001 2002 2003 2004 2005 2006 2007 2008<br />
Figure 2.1. GDP in market prices in 2000–2008. Data: Statistics Estonia.<br />
Table 2.1. GDP growth rate in European Union countries. in fixed prices with respect to<br />
the previous year’s GDP growth rate (%). Data: Eurostat.<br />
2000 2004 2005 2006 2007 2008<br />
EU (27 countries) 3.9 2.5 2.0 3.1 2.9 0.9<br />
EU (15 countries) 3.9 2.3 1.8 2.9 2.7 0.6<br />
Estonia 9.6 7.5 9.2 10.4 6.3 -3.6<br />
Table 2.2. GDP change compared to the previous year (using the chain method) by field of activity (%).<br />
Data: Statistics Estonia.<br />
Agriculture and<br />
hunting<br />
2000 2004 2005 2006 2007 2008<br />
24.8 -9.8 -0.5 2.3 -12 7.6<br />
Forestry 9.5 -8.1 -11.8 -15.3 -10.5 4.3<br />
Fishing -3.8 -9.9 1.6 4.2 8.1 3<br />
Mining 16.4 -5.6 10.4 3.4 11.9 -6.9<br />
Processing industry 19.4 10.9 11.1 11.9 9 -4<br />
Electricity, gas and<br />
water supply<br />
9.5 1.3 0.3 5.6 -3.3 -7.7<br />
Construction 18.3 9.8 25.6 17.8 10 -6<br />
Hotels and restaurants 7.5 13.9 10.9 8.6 6 -4.5<br />
Transportation,<br />
warehousing and<br />
communications<br />
7.2 8.9 8 10 6.5 -5.7<br />
19


