

ESTONIAN ENVIRONMENTAL REVIEW 2009
ESTONIAN ENVIRONMENTAL REVIEW 2009
ESTONIAN ENVIRONMENTAL REVIEW 2009

Create successful ePaper yourself
Turn your PDF publications into a flip-book with our unique Google optimized e-Paper software.
Since 2000, Estonia has kept statistics on particulate<br />
matter with an aerodynamic diameter of under 10<br />
micrometers (PM 10<br />
) as well as particulate matter under 2.5<br />
micrometers in diameter (PM 2.5<br />
). Even though emissions<br />
of respirable fraction particles (PM 2.5<br />
) in the first years<br />
that statistics were recorded (2000–2002) grew 8.6% in<br />
connection with increased emissions in transport and<br />
the manufacturing industry, the trend for PM 10<br />
and PM 2.5<br />
declined until 2006 (figure 5.8). In 2007 emissions of PM 10<br />
and PM 2.5<br />
grew fairly suddenly as the amount of oil shale<br />
burned in the energy sector grew.<br />
Pursuant to the NEC programme C the goal set for 2010<br />
was to reduce PM 10<br />
emissions to 17,330 tonnes and PM 2.5<br />
emissions to 14,770 tonnes. By 2015 emissions must fall<br />
to 16,520 and 14,640 tonnes, respectively.<br />
Comparing Estonia in terms of fine particle emission<br />
to other European Union countries on a per capita basis,<br />
Estonia cannot be satisfied with its result as PM 10<br />
emissions<br />
per capita exceed the average level of the EL 25 D<br />
countries more than threefold even though total emissions<br />
in 2006 accounted for less than 1% of the amount of<br />
PM 10<br />
discharged into the ambient air by the 25 European<br />
Union countries (figure 5.9).<br />
300<br />
250<br />
emissions, thousands of tonnes<br />
200<br />
150<br />
100<br />
50<br />
0<br />
282<br />
281<br />
252<br />
199<br />
178<br />
137<br />
126<br />
103<br />
91<br />
89<br />
77<br />
75<br />
55<br />
51<br />
48<br />
40<br />
30<br />
38<br />
25.51<br />
23.34<br />
1990 1991 1992 1993 1994 1995 1996 1997 1998 1999 2000 2001 2002 2003 2004 2005 2006 2007 2010 2015<br />
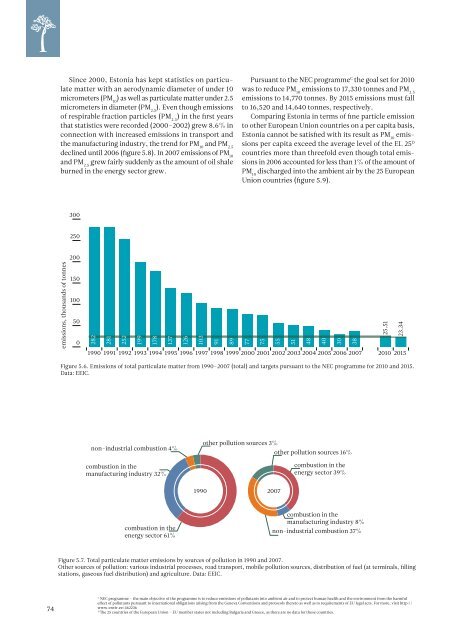
Figure 5.6. Emissions of total particulate matter from 1990–2007 (total) and targets pursuant to the NEC programme for 2010 and 2015.<br />
Data: EEIC.<br />
non-industrial combustion 4%<br />
combustion in the<br />
manufacturing industry 32%<br />
other pollution sources 3%<br />
other pollution sources 16%<br />
combustion in the<br />
energy sector 39%<br />
1990 2007<br />
combustion in the<br />
energy sector 61%<br />
combustion in the<br />
manufacturing industry 8%<br />
non-industrial combustion 37%<br />
Figure 5.7. Total particulate matter emissions by sources of pollution in 1990 and 2007.<br />
Other sources of pollution: various industrial processes, road transport, mobile pollution sources, distribution of fuel (at terminals, filling<br />
stations, gaseous fuel distribution) and agriculture. Data: EEIC.<br />
74<br />
C<br />
NEC programme – the main objective of the programme is to reduce emissions of pollutants into ambient air and to protect human health and the environment from the harmful<br />
effect of pollutants pursuant to international obligations arising from the Geneva Conventions and protocols thereto as well as to requirements of EU legal acts. For more, visit http://<br />
www.envir.ee/462236<br />
D<br />
The 25 countries of the European Union – EU member states not including Bulgaria and Greece, as there are no data for these countries.


