

ESTONIAN ENVIRONMENTAL REVIEW 2009
ESTONIAN ENVIRONMENTAL REVIEW 2009
ESTONIAN ENVIRONMENTAL REVIEW 2009

Create successful ePaper yourself
Turn your PDF publications into a flip-book with our unique Google optimized e-Paper software.
Table 8.2 Abundance and trends for top-predators specified in the Environmental Strategy.<br />
Data: National Environmental Monitoring Programme, Eagle Club.<br />
Category Baseline level in 2004,<br />
number of pairs<br />
Status, number of<br />
pairs in 2008<br />
Trend<br />
Black stork 100–115 80 decline <br />
White-tailed eagle 140 165 rise <br />
Osprey 45 55 rise <br />
Golden eagle 45 55 rise <br />
Greater spotted eagle 20–30 20 decline <br />
Lesser spotted eagle 500–600 550 stable <br />
Threatened species<br />
According to the list of species in the Estonian Red<br />
Book, the level of threat of only about 4300 species<br />
indigenous to Estonia (16%) has been assessed. As a result<br />
of the last assessment, there are 1296 threatened species<br />
in Estonia (about 30% of the species assessed) D . A total<br />
of 295 species (7% of all species assessed and around 1%<br />
of all species found in Estonia) are considered extinct or<br />
nearly extinct in Estonia.<br />
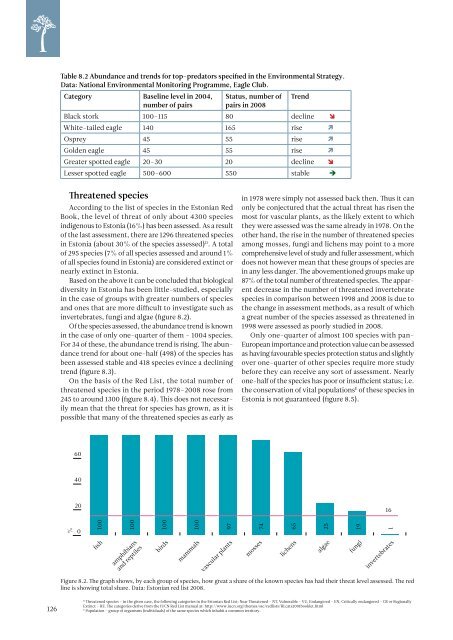
Based on the above it can be concluded that biological<br />
diversity in Estonia has been little-studied, especially<br />
in the case of groups with greater numbers of species<br />
and ones that are more difficult to investigate such as<br />
invertebrates, fungi and algae (figure 8.2).<br />
Of the species assessed, the abundance trend is known<br />
in the case of only one-quarter of them – 1004 species.<br />
For 34 of these, the abundance trend is rising. The abundance<br />
trend for about one-half (498) of the species has<br />
been assessed stable and 418 species evince a declining<br />
trend (figure 8.3).<br />
On the basis of the Red List, the total number of<br />
threatened species in the period 1978–2008 rose from<br />
245 to around 1300 (figure 8.4). This does not necessarily<br />
mean that the threat for species has grown, as it is<br />
100<br />
possible that many of the threatened species as early as<br />
80<br />
in 1978 were simply not assessed back then. Thus it can<br />
only be conjectured that the actual threat has risen the<br />
most for vascular plants, as the likely extent to which<br />
they were assessed was the same already in 1978. On the<br />
other hand, the rise in the number of threatened species<br />
among mosses, fungi and lichens may point to a more<br />
comprehensive level of study and fuller assessment, which<br />
does not however mean that these groups of species are<br />
in any less danger. The abovementioned groups make up<br />
87% of the total number of threatened species. The apparent<br />
decrease in the number of threatened invertebrate<br />
species in comparison between 1998 and 2008 is due to<br />
the change in assessment methods, as a result of which<br />
a great number of the species assessed as threatened in<br />
1998 were assessed as poorly studied in 2008.<br />
Only one-quarter of almost 100 species with pan-<br />
European importance and protection value can be assessed<br />
as having favourable species protection status and slightly<br />
over one-quarter of other species require more study<br />
before they can receive any sort of assessment. Nearly<br />
one-half of the species has poor or insufficient status; i.e.<br />
the conservation of vital populations E of these species in<br />
Estonia is not guaranteed (figure 8.5).<br />
60<br />
40<br />
20<br />
16<br />
%<br />
0<br />
100<br />
100<br />
100<br />
100<br />
97<br />
74<br />
65<br />
25<br />
19<br />
1<br />
fish<br />
amphibians<br />
and reptiles<br />
birds<br />
mammals<br />
vascular plants<br />
mosses<br />
lichens<br />
algae<br />
fungi<br />
invertebrates<br />
Figure 8.2. The graph shows, by each group of species, how great a share of the known species has had their threat level assessed. The red<br />
line is showing total share. Data: Estonian red list 2008.<br />
126<br />
D<br />
Threatened species – in the given case, the following categories in the Estonian Red List: Near Threatened – NT, Vulnerable – VU, Endangered – EN, Critically endangered – CR or Regionally<br />
Extinct – RE. The categories derive from the IUCN Red List manual at: http://www.iucn.org/themes/ssc/redlists/RLcats2001booklet.html<br />
E<br />
Population – group of organisms (individuals) of the same species which inhabit a common territory.<br />
kokku


