

ESTONIAN ENVIRONMENTAL REVIEW 2009
ESTONIAN ENVIRONMENTAL REVIEW 2009
ESTONIAN ENVIRONMENTAL REVIEW 2009

You also want an ePaper? Increase the reach of your titles
YUMPU automatically turns print PDFs into web optimized ePapers that Google loves.
Narva-<br />
Jõesuu<br />
Paldiski<br />
Tallinn<br />
Keila<br />
Jüri<br />
Maardu<br />
Loksa<br />
Kehra<br />
Kadrina<br />
Tapa<br />
Kunda<br />
Rakvere<br />
Aseri<br />
Ahtme<br />
Kohtla-Järve<br />
Sillamäe<br />
Narva<br />
Kärdla<br />
Haapsalu<br />
Märjamaa<br />
Kohila<br />
Rapla<br />
Kose<br />
Tamsalu<br />
Paide<br />
Väike-Maarja<br />
Türi<br />
Jõgeva<br />
Vändra<br />
Põltsamaa<br />
Pärnu<br />
Viljandi<br />
Kuressaare<br />
Elva<br />
Tartu<br />
Towns<br />
< 5<br />
Counties<br />
< 15<br />
Kilingi-Nõmme<br />
Karksi-Nuia<br />
Tõrva<br />
Otepää<br />
Põlva<br />
Räpina<br />
5 - 25<br />
15 - 50<br />
25 - 50<br />
50 - 150<br />
50 - 150<br />
150 - 300<br />
> 300<br />
Valga<br />
Võru<br />
> 150<br />
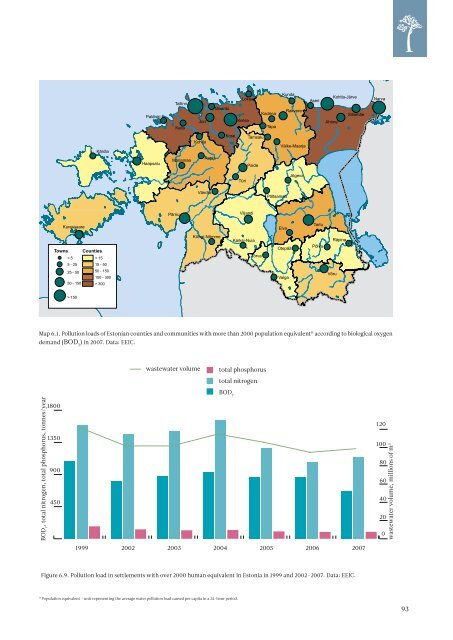
Map 6.1. Pollution loads of Estonian counties and communities with more than 2000 population equivalent H according to biological oxygen<br />
demand (BOD 7<br />
) in 2007. Data: EEIC.<br />
wastewater volume<br />
total phosphorus<br />
total nitrogen<br />
BOD 7<br />
BOD 7<br />
, total nitrogen, total phosphorus, tonnes/year<br />
1800<br />
1350<br />
900<br />
450<br />
0<br />
120<br />
100<br />
80<br />
60<br />
40<br />
20<br />
0<br />
wastewater volume, millions of m 3<br />
1999 2002 2003 2004 2005 2006 2007<br />
Figure 6.9. Pollution load in settlements with over 2000 human equivalent in Estonia in 1999 and 2002–2007. Data: EEIC.<br />
H<br />
Population equivalent – unit representing the average water pollution load caused per capita in a 24-hour period.<br />
93


