

ESTONIAN ENVIRONMENTAL REVIEW 2009
ESTONIAN ENVIRONMENTAL REVIEW 2009
ESTONIAN ENVIRONMENTAL REVIEW 2009

You also want an ePaper? Increase the reach of your titles
YUMPU automatically turns print PDFs into web optimized ePapers that Google loves.
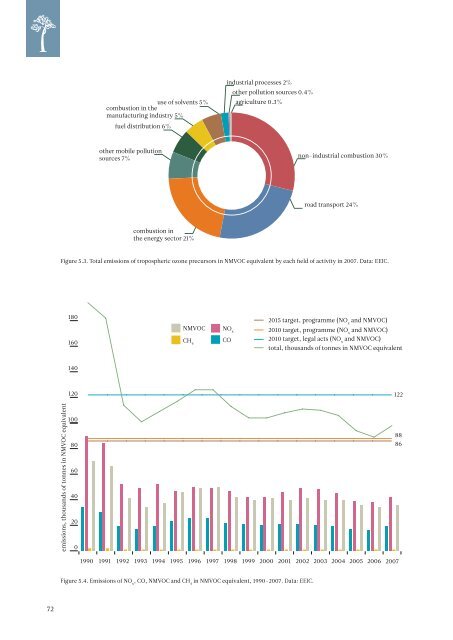
use of solvents 5% agriculture 0.3%<br />
combustion in the<br />
manufacturing industry 5%<br />
fuel distribution 6%<br />
industrial processes 2%<br />
other pollution sources 0.4%<br />
other mobile pollution<br />
sources 7%<br />
non-industrial combustion 30%<br />
road transport 24%<br />
combustion in<br />
the energy sector 21%<br />
Figure 5.3. Total emissions of tropospheric ozone precursors in NMVOC equivalent by each field of activity in 2007. Data: EEIC.<br />
180<br />
160<br />
NMVOC<br />
CH 4<br />
NO x<br />
CO<br />
2015 target, programme (NO x<br />
and NMVOC)<br />
2010 target, programme (NO x<br />
and NMVOC)<br />
2010 target, legal acts (NO x<br />
and NMVOC)<br />
total, thousands of tonnes in NMVOC equivalent<br />
140<br />
120<br />
122<br />
emissions, thousands of tonnes in NMVOC equivalent<br />
100<br />
80<br />
60<br />
40<br />
20<br />
0<br />
1990 1991 1992 1993 1994 1995 1996 1997 1998 1999 2000 2001 2002 2003 2004 2005 2006 2007<br />
88<br />
86<br />
Figure 5.4. Emissions of NO x<br />
, CO, NMVOC and CH 4<br />
in NMVOC equivalent, 1990–2007. Data: EEIC.<br />
72


