

ESTONIAN ENVIRONMENTAL REVIEW 2009
ESTONIAN ENVIRONMENTAL REVIEW 2009
ESTONIAN ENVIRONMENTAL REVIEW 2009

Create successful ePaper yourself
Turn your PDF publications into a flip-book with our unique Google optimized e-Paper software.
7.2.2. Changes in land use as reflected by<br />
Statistics Estonia data<br />
Certain changes in land use can also be seen in the<br />
data collected by Statistics Estonia. Statistics Estonia<br />
emphasizes that the data are not definitive. Spring-time<br />
cultivation areas are registered by the Farm Structure<br />
Survey, which may vary from the ultimate cultivation<br />
areas classified according to harvest purpose. The data<br />
have also been rounded off. Still, they provide some sense<br />
of the dynamics at work here.<br />
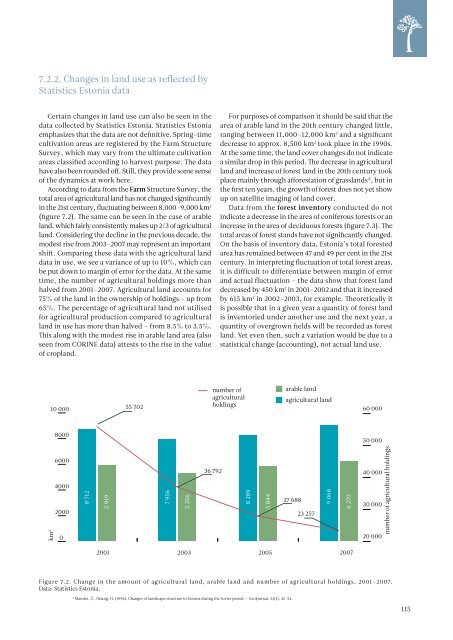
According to data from the Farm Structure Survey, the<br />
total area of agricultural land has not changed significantly<br />
in the 21st century, fluctuating between 8,000–9,000 km 2<br />
(figure 7.2). The same can be seen in the case of arable<br />
land, which fairly consistently makes up 2/3 of agricultural<br />
land. Considering the decline in the previous decade, the<br />
modest rise from 2003–2007 may represent an important<br />
shift. Comparing these data with the agricultural land<br />
data in use, we see a variance of up to 10%, which can<br />
be put down to margin of error for the data. At the same<br />
time, the number of agricultural holdings more than<br />
halved from 2001–2007. Agricultural land accounts for<br />
75% of the land in the ownership of holdings – up from<br />
65%. The percentage of agricultural land not utilised<br />
for agricultural production compared to agricultural<br />
land in use has more than halved – from 8.5% to 3.5%.<br />
This along with the modest rise in arable land area (also<br />
seen from CORINE data) attests to the rise in the value<br />
of cropland.<br />
For purposes of comparison it should be said that the<br />
area of arable land in the 20th century changed little,<br />
ranging between 11,000–12,000 km 2 and a significant<br />
decrease to approx. 8,500 km 2 took place in the 1990s.<br />
At the same time, the land cover changes do not indicate<br />
a similar drop in this period. The decrease in agricultural<br />
land and increase of forest land in the 20th century took<br />
place mainly through afforestation of grasslands A , but in<br />
the first ten years, the growth of forest does not yet show<br />
up on satellite imaging of land cover.<br />
Data from the forest inventory conducted do not<br />
indicate a decrease in the area of coniferous forests or an<br />
increase in the area of deciduous forests (figure 7.3). The<br />
total areas of forest stands have not significantly changed.<br />
On the basis of inventory data, Estonia’s total forested<br />
area has remained between 47 and 49 per cent in the 21st<br />
century. In interpreting fluctuation of total forest areas,<br />
it is difficult to differentiate between margin of error<br />
and actual fluctuation – the data show that forest land<br />
decreased by 450 km 2 in 2001–2002 and that it increased<br />
by 615 km 2 in 2002–2003, for example. Theoretically it<br />
is possible that in a given year a quantity of forest land<br />
is inventoried under another use and the next year, a<br />
quantity of overgrown fields will be recorded as forest<br />
land. Yet even then, such a variation would be due to a<br />
statistical change (accounting), not actual land use.<br />
10 000<br />
55 702<br />
number of<br />
agricultural<br />
holdings<br />
arable land<br />
agricultural land<br />
60 000<br />
8000<br />
50 000<br />
km 2 8 712<br />
6000<br />
4000<br />
2000<br />
0<br />
5 919<br />
7 956<br />
5 356<br />
36 792<br />
8 289<br />
5 844<br />
27 688<br />
23 257<br />
9 068<br />
6 270<br />
40 000<br />
30 000<br />
20 000<br />
number of agricultural holdings<br />
2001<br />
2003<br />
2005<br />
2007<br />
Figure 7.2. Change in the amount of agricultural land, arable land and number of agricultural holdings, 2001–2007.<br />
Data: Statistics Estonia.<br />
A<br />
Mander, Ü., Palang, H. (1994). Changes of landscape structure in Estonia during the Soviet period. – GeoJournal, 33(1), 45-54.<br />
115


