

ESTONIAN ENVIRONMENTAL REVIEW 2009
ESTONIAN ENVIRONMENTAL REVIEW 2009
ESTONIAN ENVIRONMENTAL REVIEW 2009

Create successful ePaper yourself
Turn your PDF publications into a flip-book with our unique Google optimized e-Paper software.
20<br />
total waste generated<br />
hazardous waste<br />
non-hazardous waste<br />
18.4<br />
17.4<br />
18.5<br />
20.0<br />
21.2<br />
16<br />
12<br />
13.4<br />
14.7 14.4<br />
13.0<br />
10.8<br />
11.6<br />
12.8<br />
14.4<br />
8<br />
millions of tonnes<br />
4<br />
0<br />
6.1<br />
7.3<br />
7.0<br />
7.7<br />
7.0<br />
7.4<br />
6.7<br />
6.3<br />
5.2<br />
5.6<br />
5.7<br />
6.0<br />
6.6<br />
6.2<br />
8.0<br />
6.4<br />
10.9<br />
7.5<br />
10.2<br />
7.2<br />
11.5<br />
7.0<br />
13.2<br />
6.8<br />
12.6<br />
8.6<br />
1995 1996 1997 1998 1999 2000<br />
2001 2002 2003 2004<br />
2005 2006<br />
2007<br />
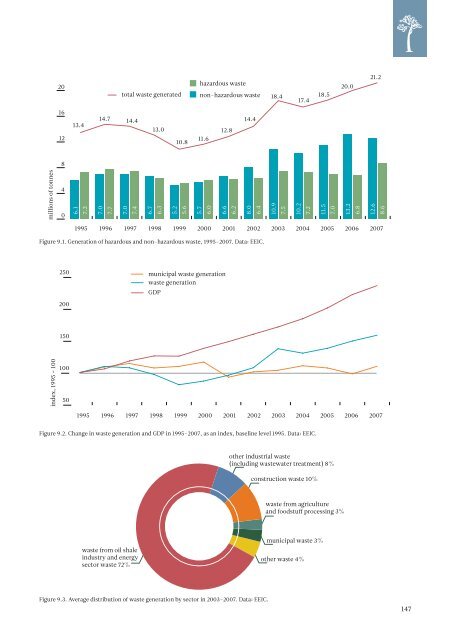
Figure 9.1. Generation of hazardous and non-hazardous waste, 1995–2007. Data: EEIC.<br />
250 municipal waste generation<br />
waste generation<br />
200<br />
GDP<br />
150<br />
index, 1995 = 100<br />
100<br />
50<br />
1995<br />
1996<br />
1997<br />
1998<br />
1999<br />
2000<br />
2001 2002 2003 2004 2005 2006 2007<br />
Figure 9.2. Change in waste generation and GDP in 1995–2007, as an index, baseline level 1995. Data: EEIC.<br />
other industrial waste<br />
(including wastewater treatment) 8%<br />
construction waste 10%<br />
waste from agriculture<br />
and foodstuff processing 3%<br />
waste from oil shale<br />
industry and energy<br />
sector waste 72%<br />
municipal waste 3%<br />
other waste 4%<br />
Figure 9.3. Average distribution of waste generation by sector in 2003–2007. Data: EEIC.<br />
147


